FMP, TTI, WTF? Making Sense of Performance Metrics
A presentation at Web Unleashed by Ire Aderinokun
FMP, TTI, WTF? 🤔 Making Sense of Pe fo mance Met ics r r r Ire Aderinokun Web Unleashed 2021

Ire Aderinokun 🇳🇬 🇬🇧 Cofounder & VP Engineering of Helicarrier Google Web Expert
Performance metrics can be confusing 😕
Why is performance important?
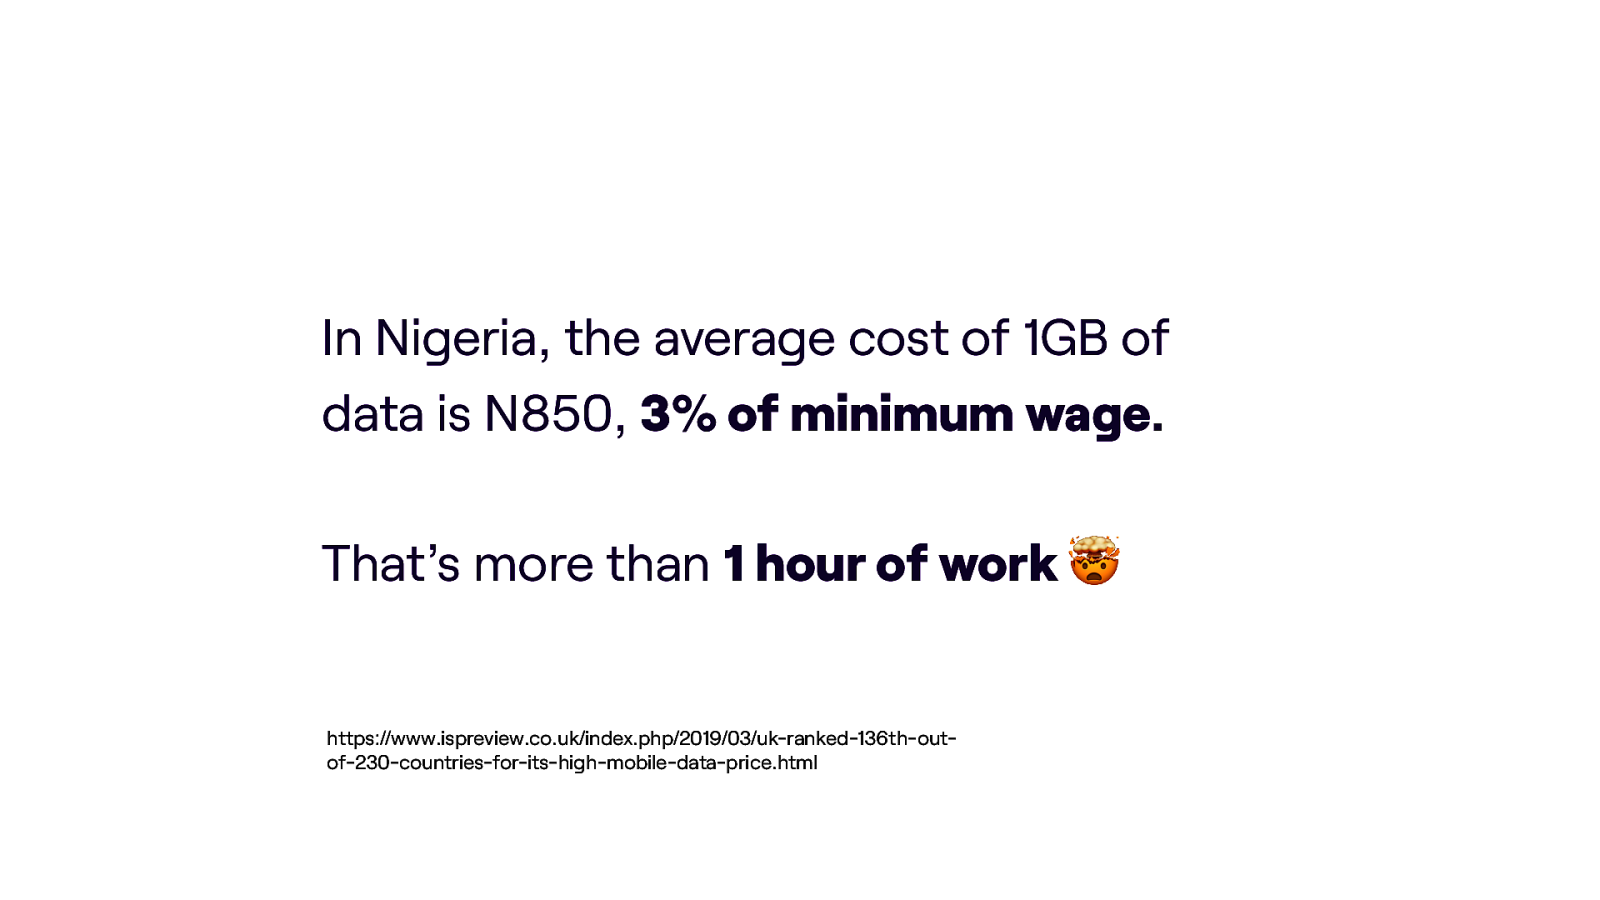
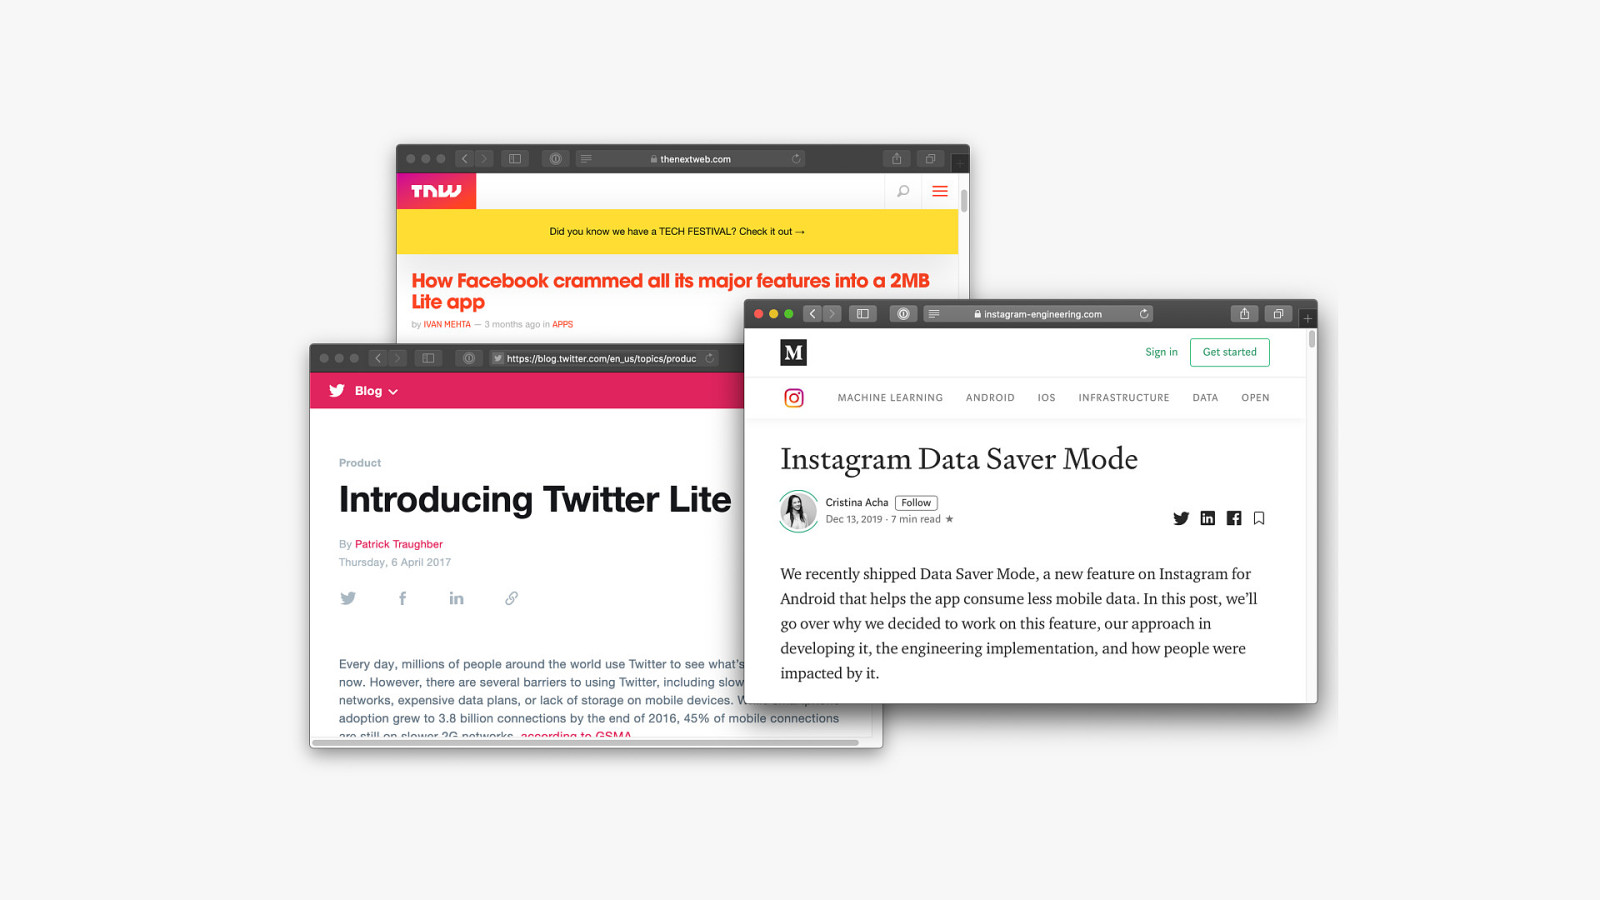
In Nigeria, the average cost of 1GB of data is N850, 3% of minimum wage. That’s more than 1 hour of work 🤯 https://www.ispreview.co.uk/index.php/2019/03/uk-ranked-136th-outof-230-countries-for-its-high-mobile-data-price.html
In the US, minimum wage employees have to work almost 2 hours to earn enough for 1GB of mobile data 🤯 https://www.ispreview.co.uk/index.php/2019/03/uk-ranked-136th-outof-230-countries-for-its-high-mobile-data-price.html

Having a performant website is a competitive advantage 😎
Having a performant website is just like having good service in the physical world.. …but your customers are less patient 😡

Users are 90% more likely to abandon a page that takes up to 5 seconds to load thinkwithgoogle.com/marketing-resources/data-measurement/mobilepage-speed-new-industry-benchmarks

What does performant actually mean for your site?
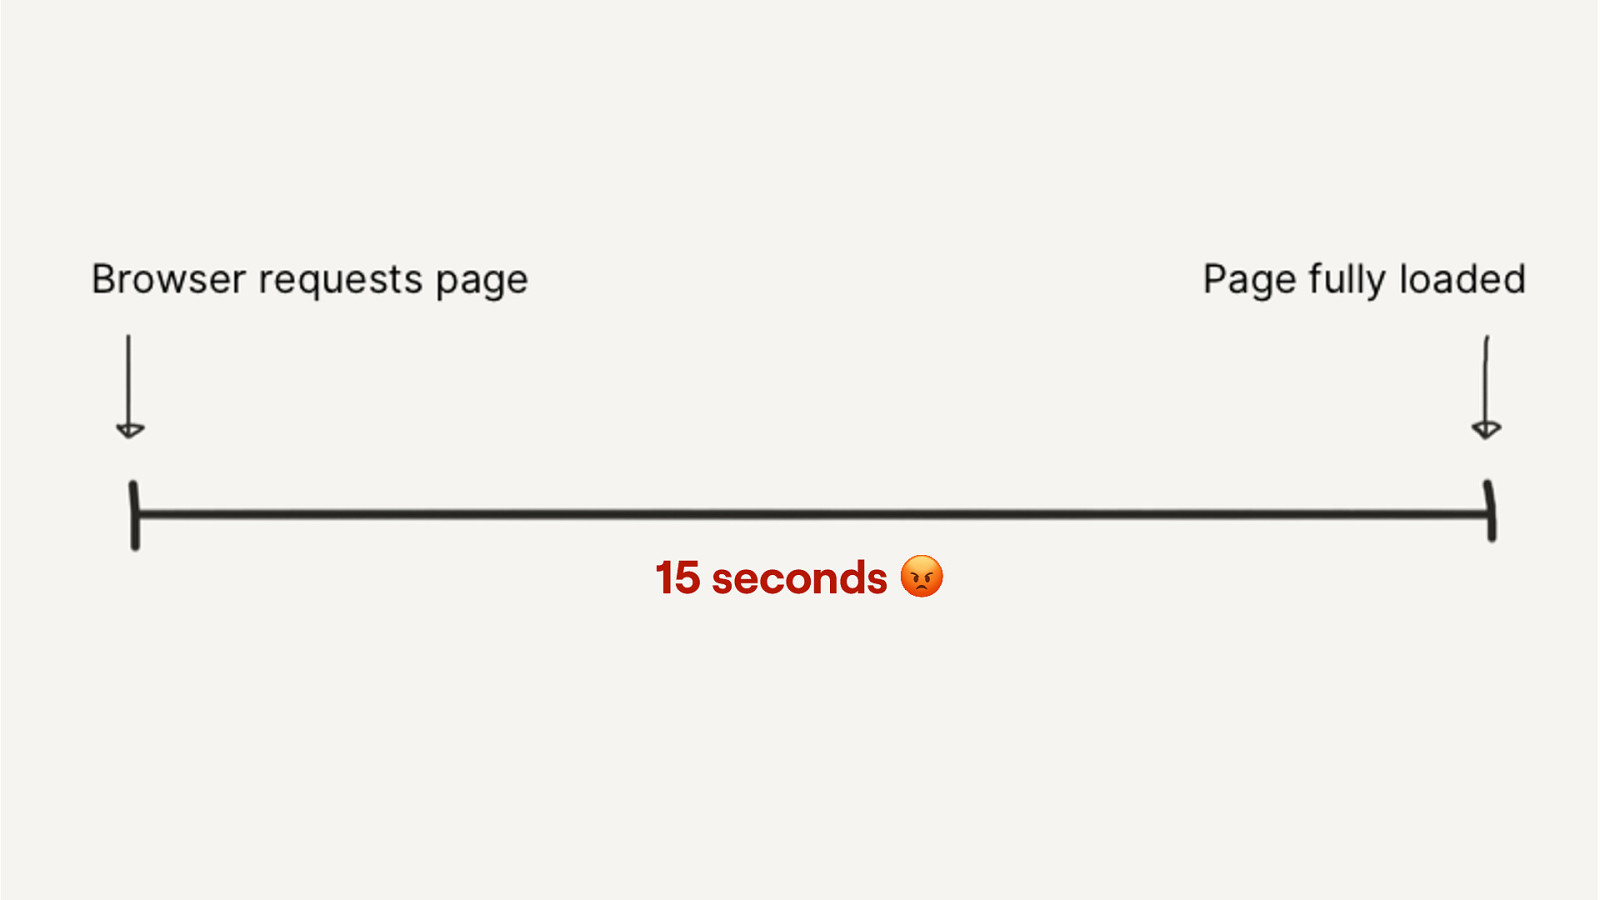
15 seconds 😡
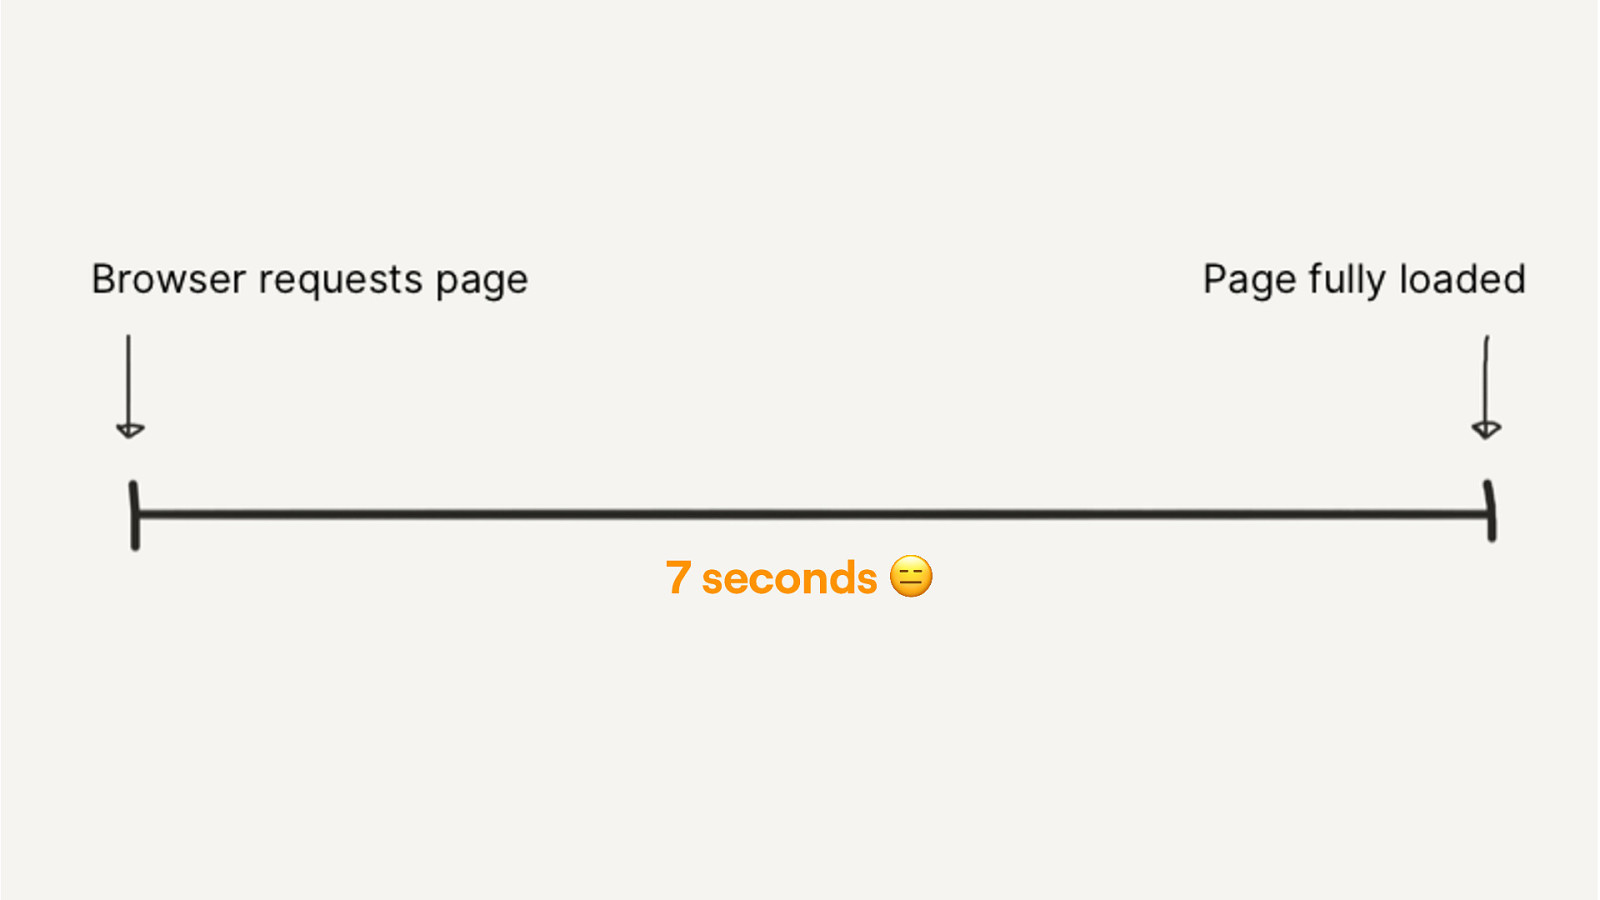
7 seconds 😑
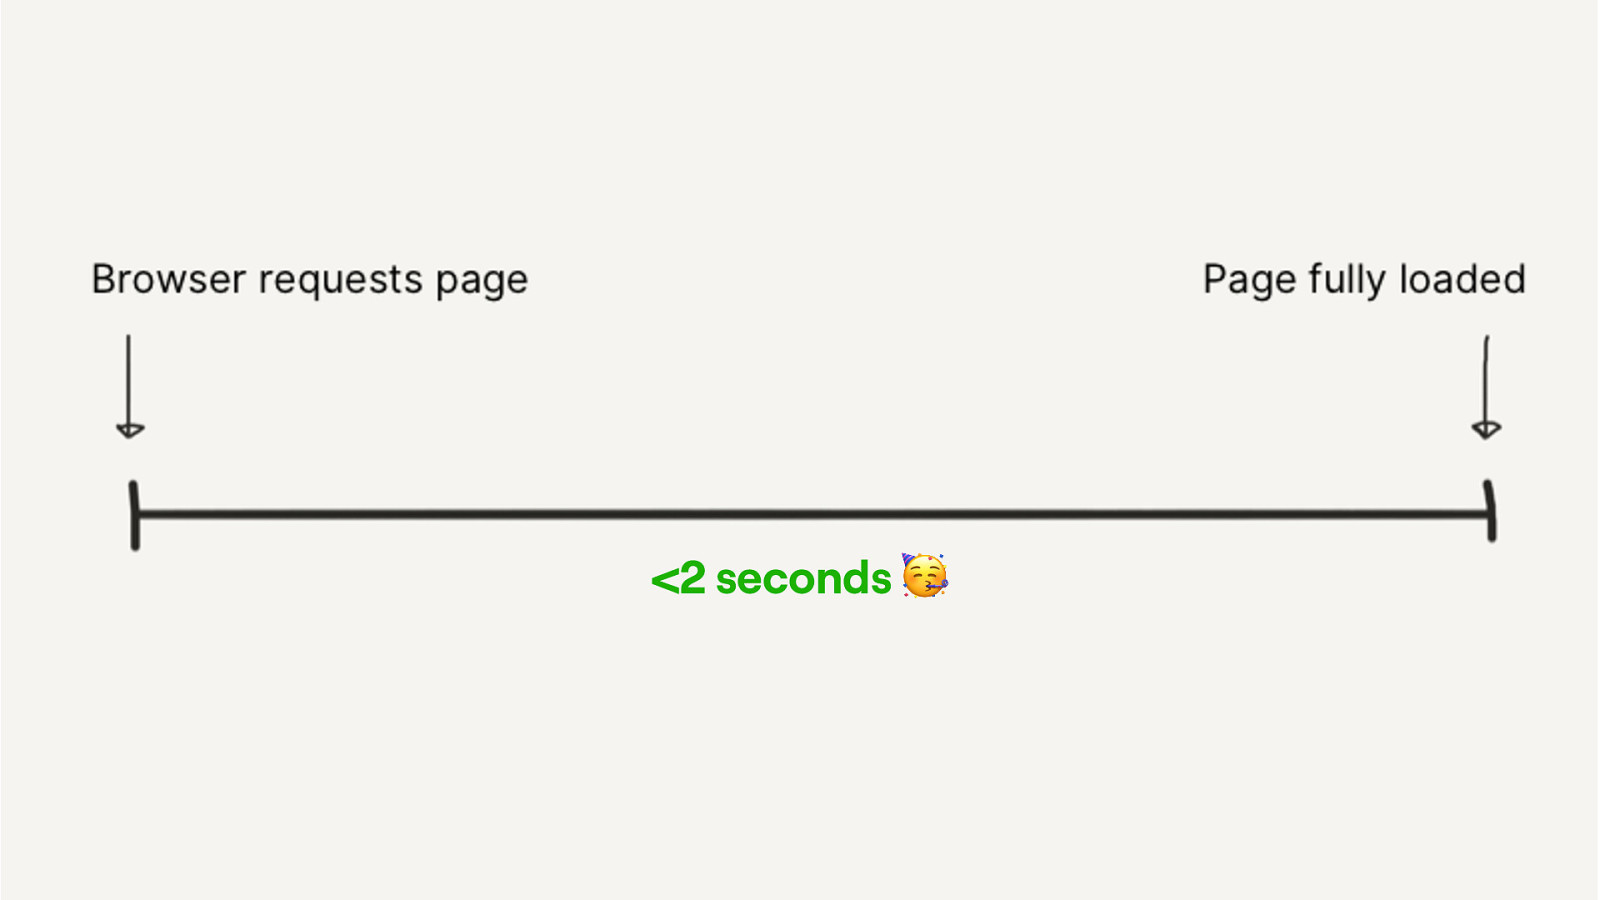
<2 seconds 🥳
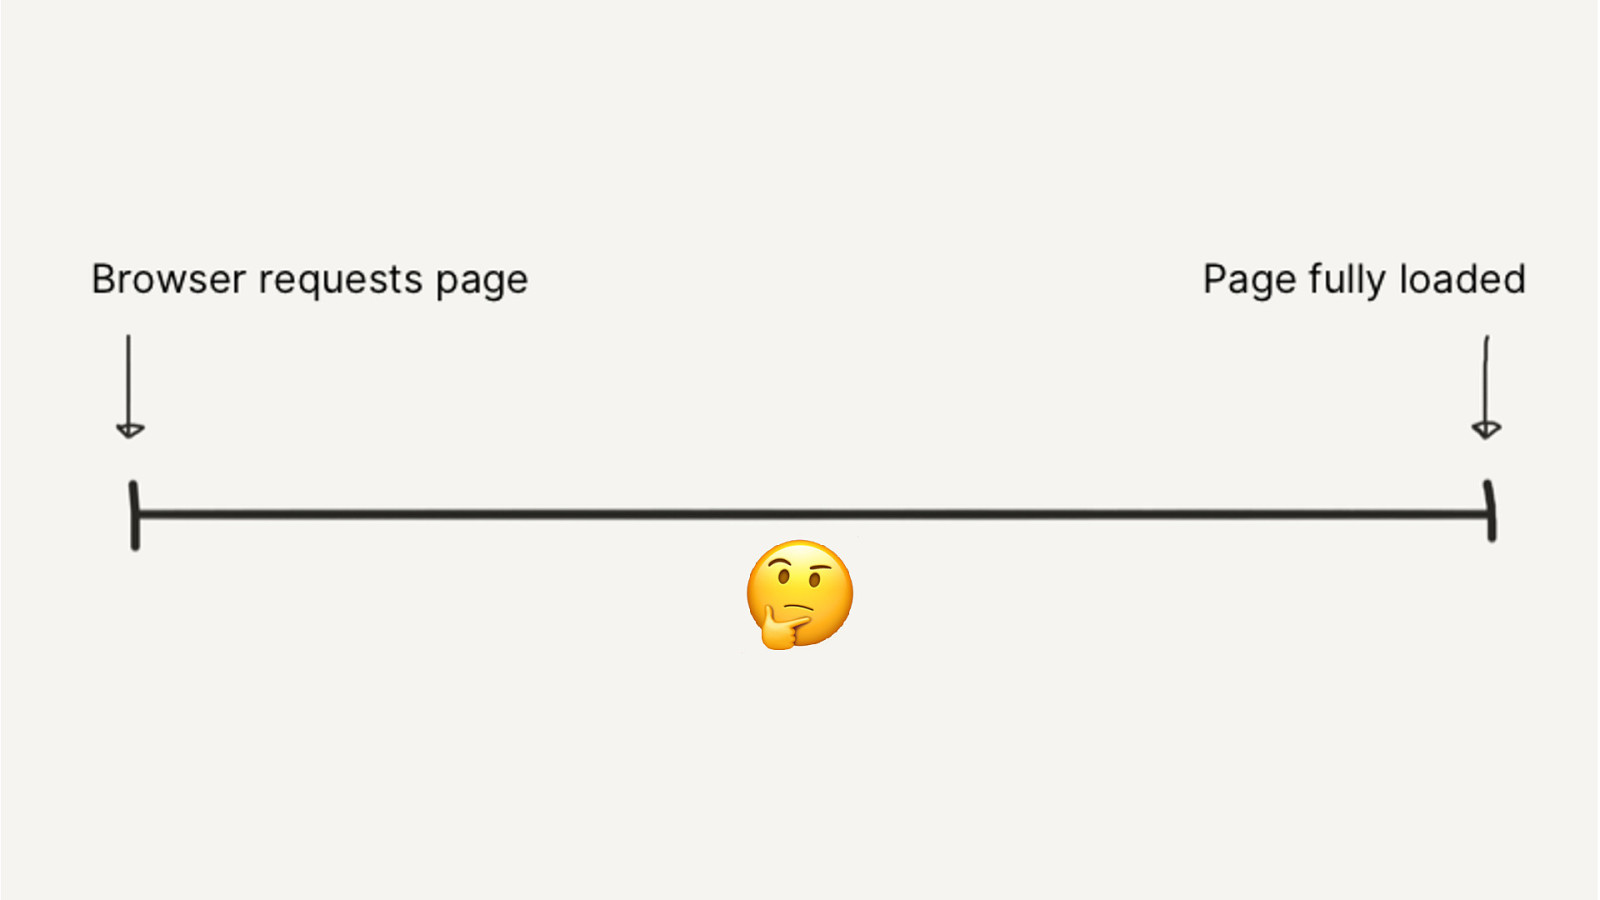
🤔
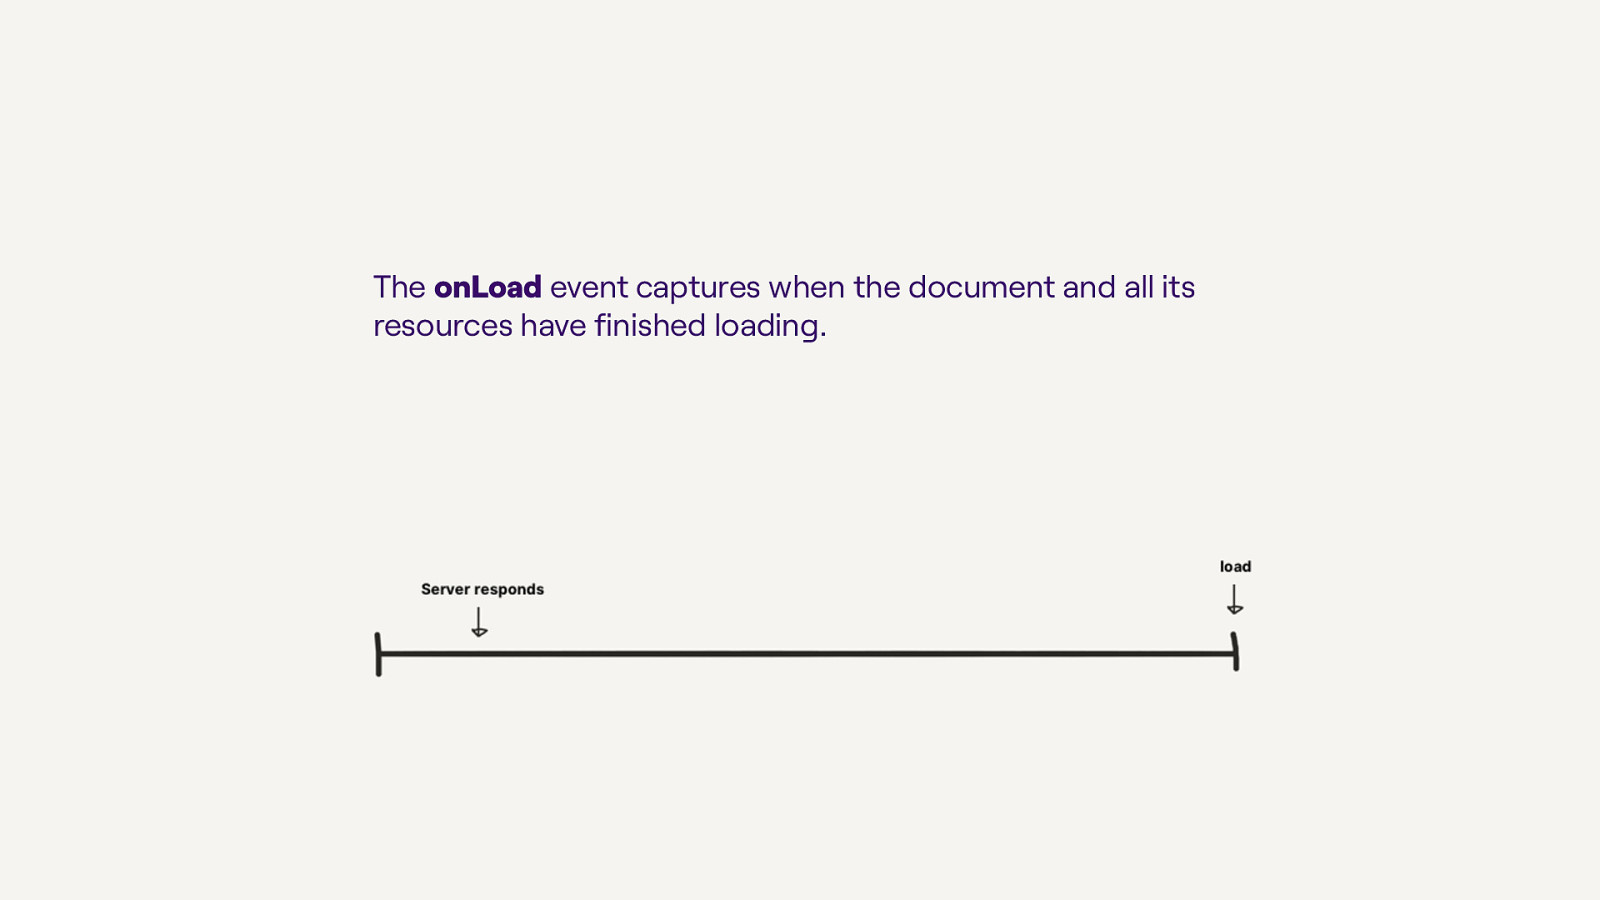
The onLoad event captures when the document and all its resources have finished loading.

var start = Date.now(); window.addEventListener(‘load’, function() { var end = Date.now(); var loadTime = end - start; });

var start = Date.now(); window.addEventListener(‘load’, function() { var end = Date.now(); var loadTime = end - start; });

var start = Date.now(); window.addEventListener(‘load’, function() { var end = Date.now(); var loadTime = end - start; });
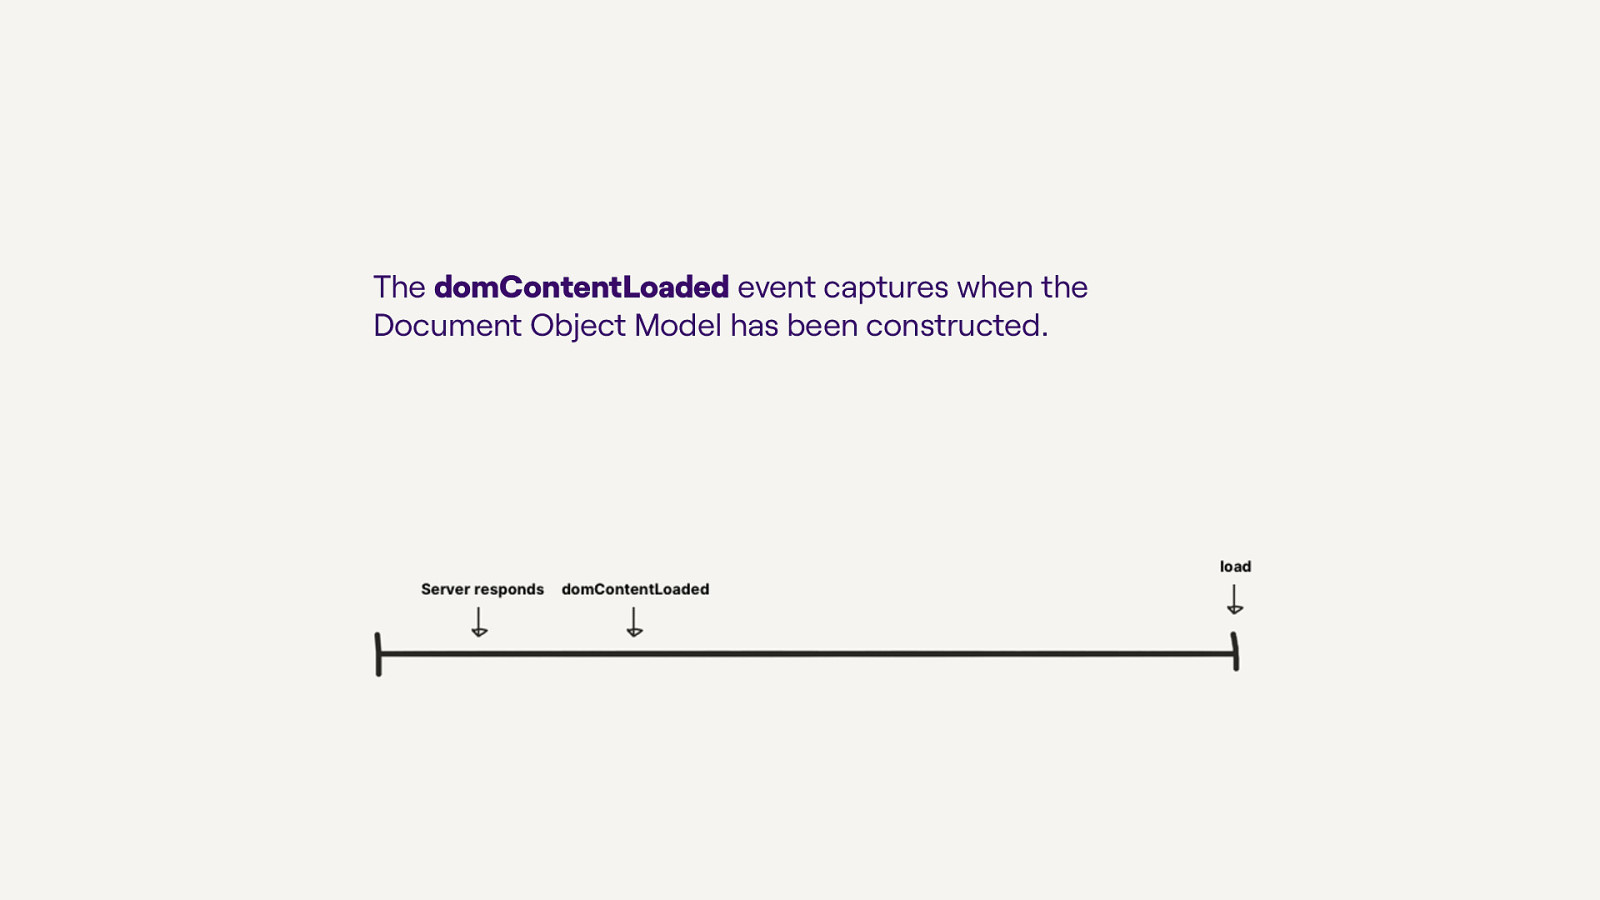
The domContentLoaded event captures when the Document Object Model has been constructed.

var start = Date.now(); window.addEventListener(‘domContentLoaded’, function() { var end = Date.now(); var loadTime = end - start; });
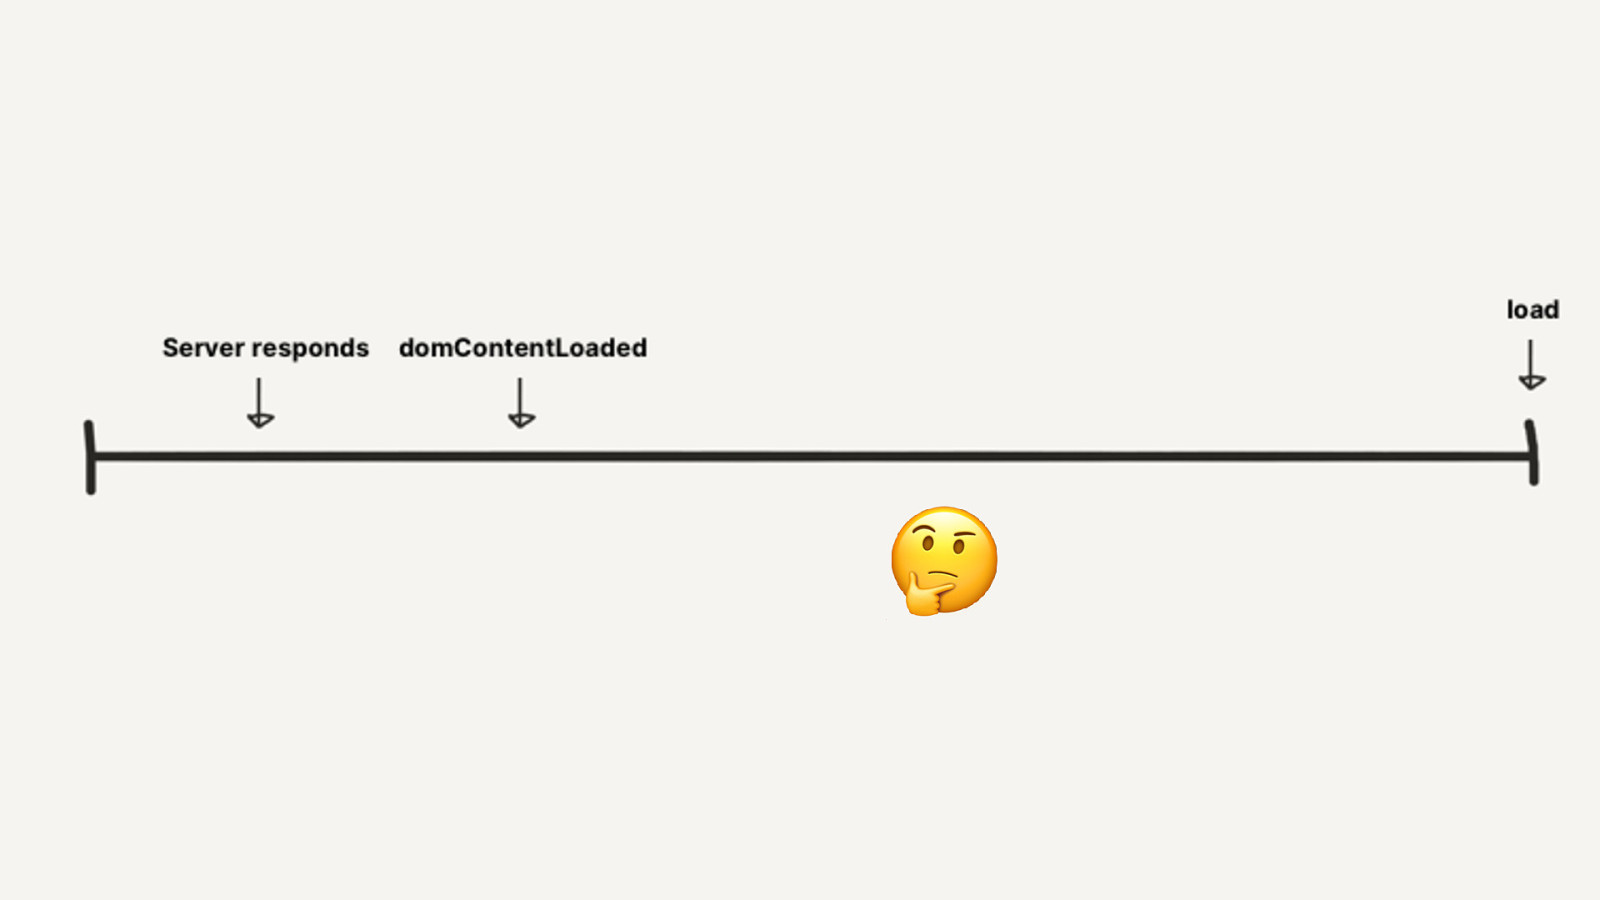
🤔
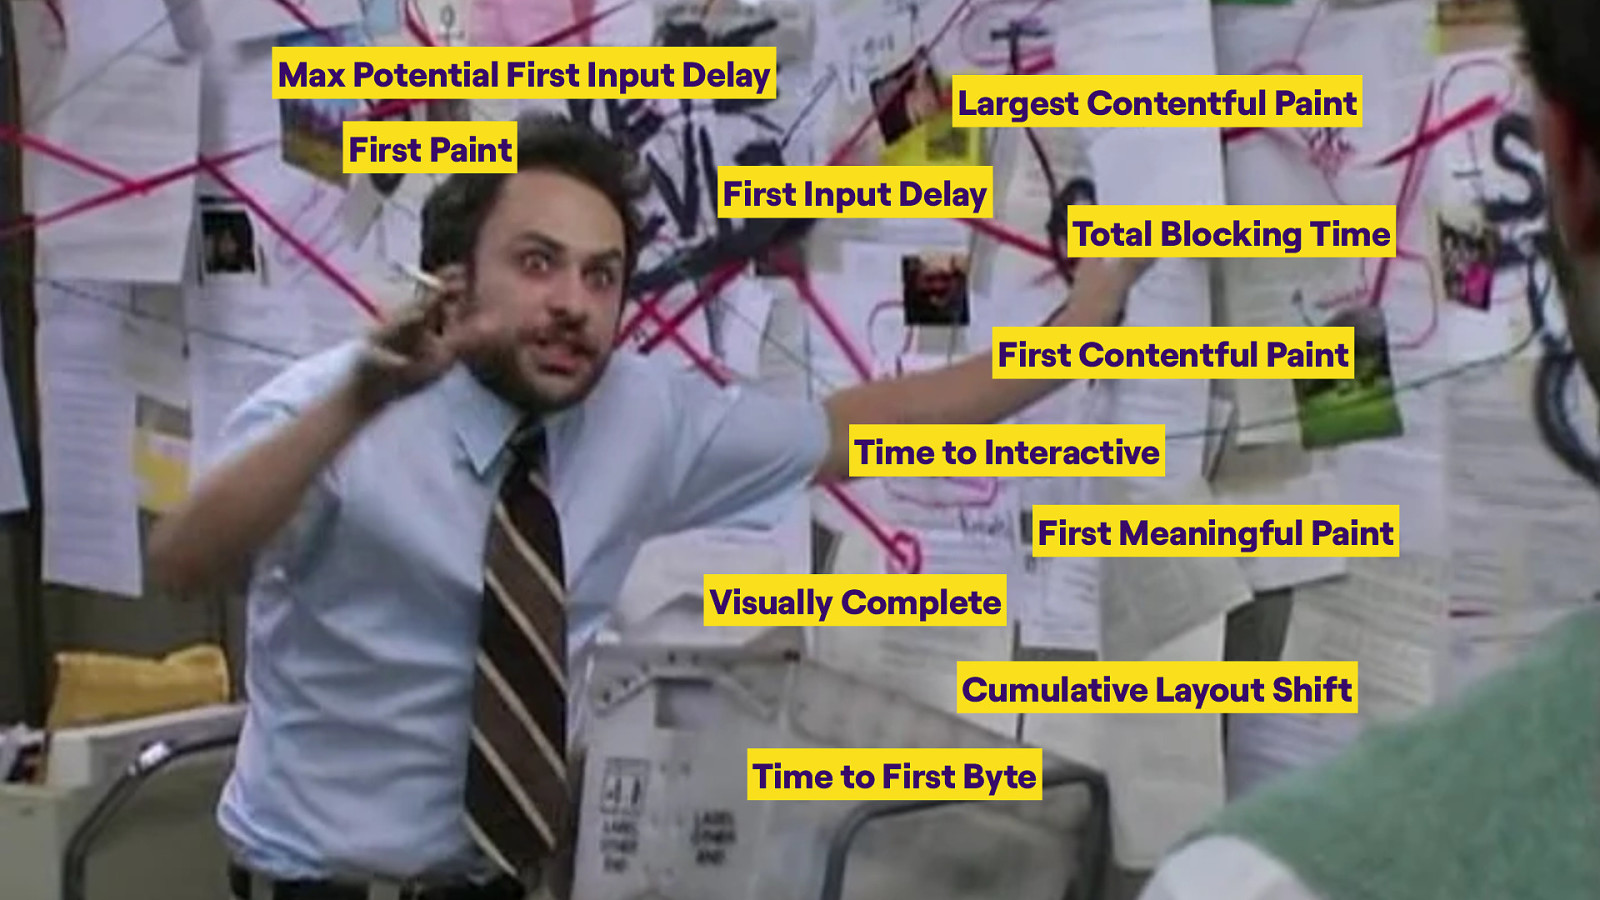
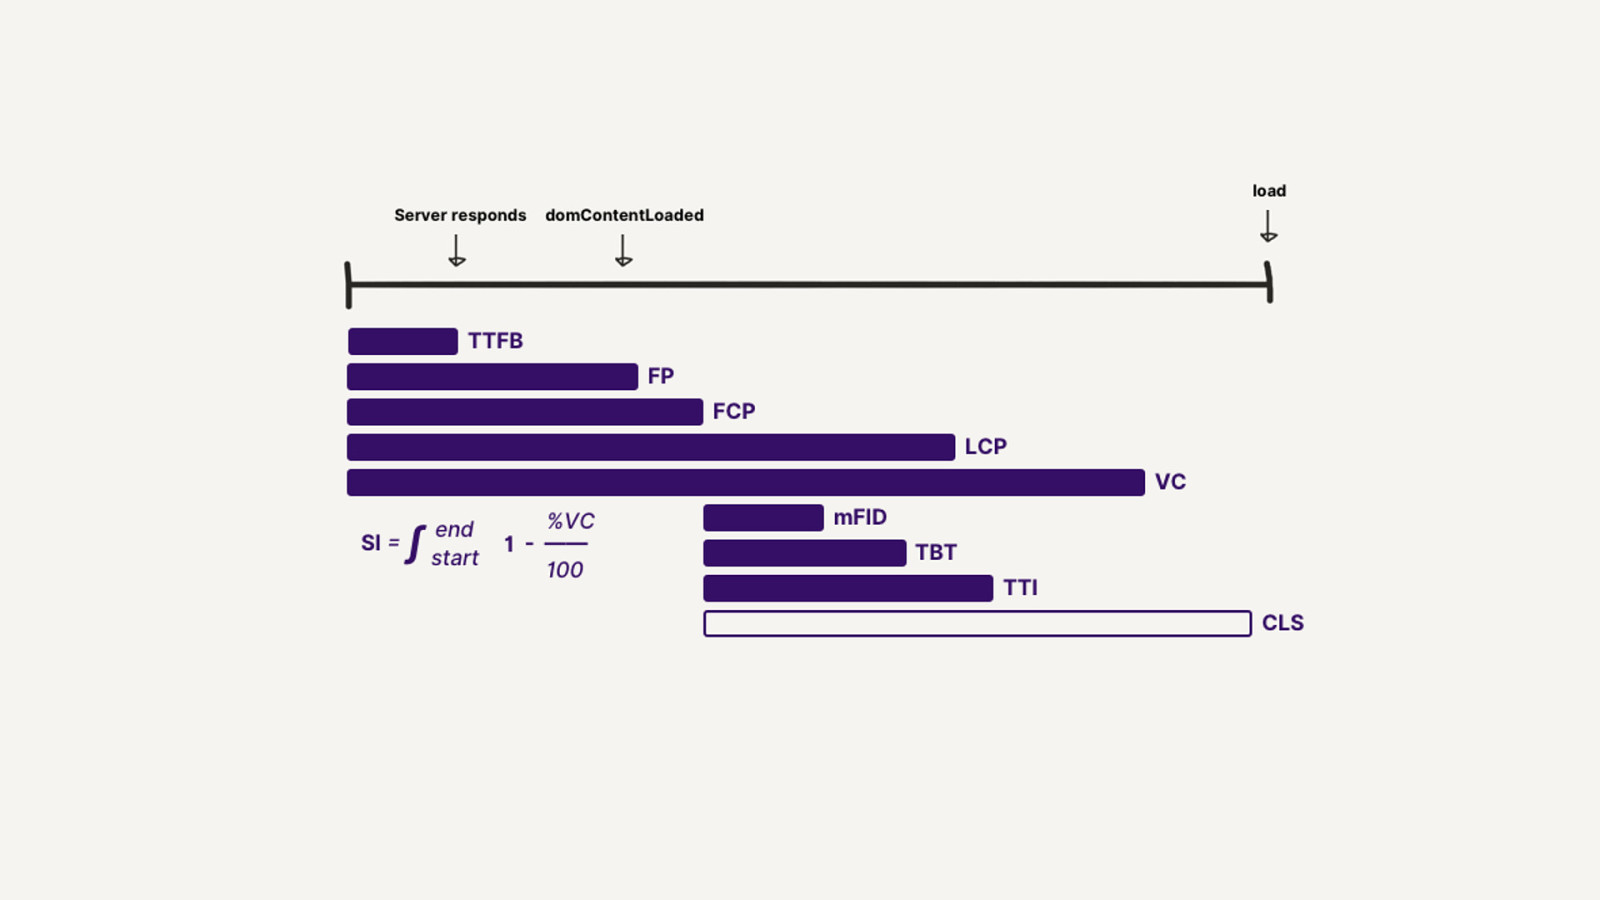
Max Potential First Input Delay Largest Contentful Paint First Paint First Input Delay Total Blocking Time First Contentful Paint Time to Interactive First Meaningful Paint Visually Complete Cumulative Layout Shift Time to First Byte
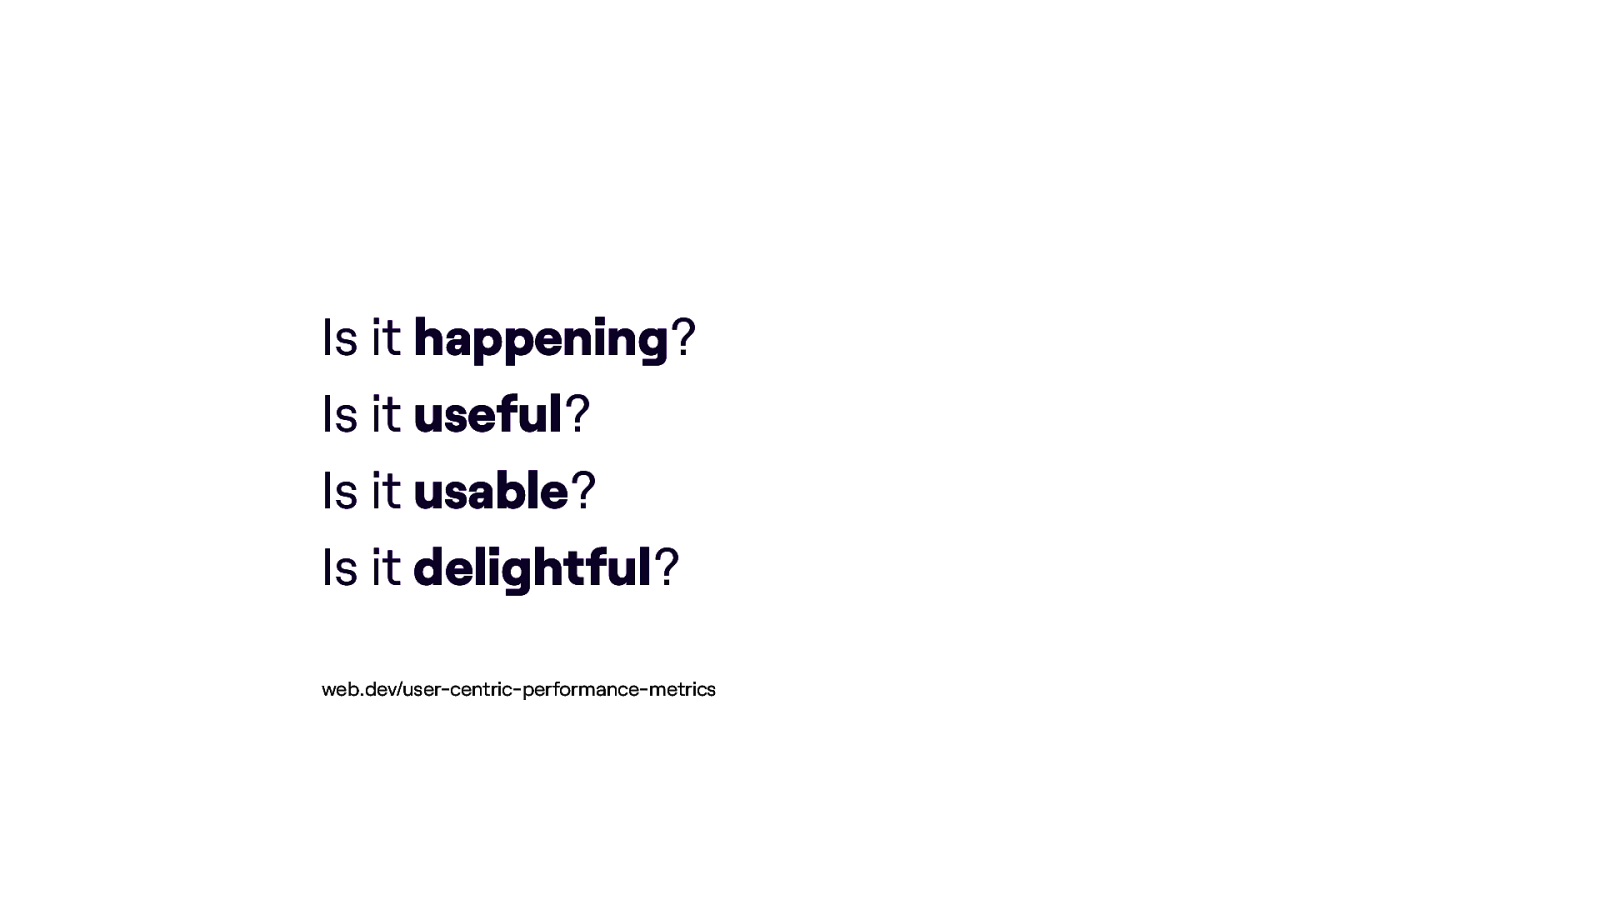
Is it happening? Is it useful? Is it usable? Is it delightful? web.dev/user-centric-performance-metrics
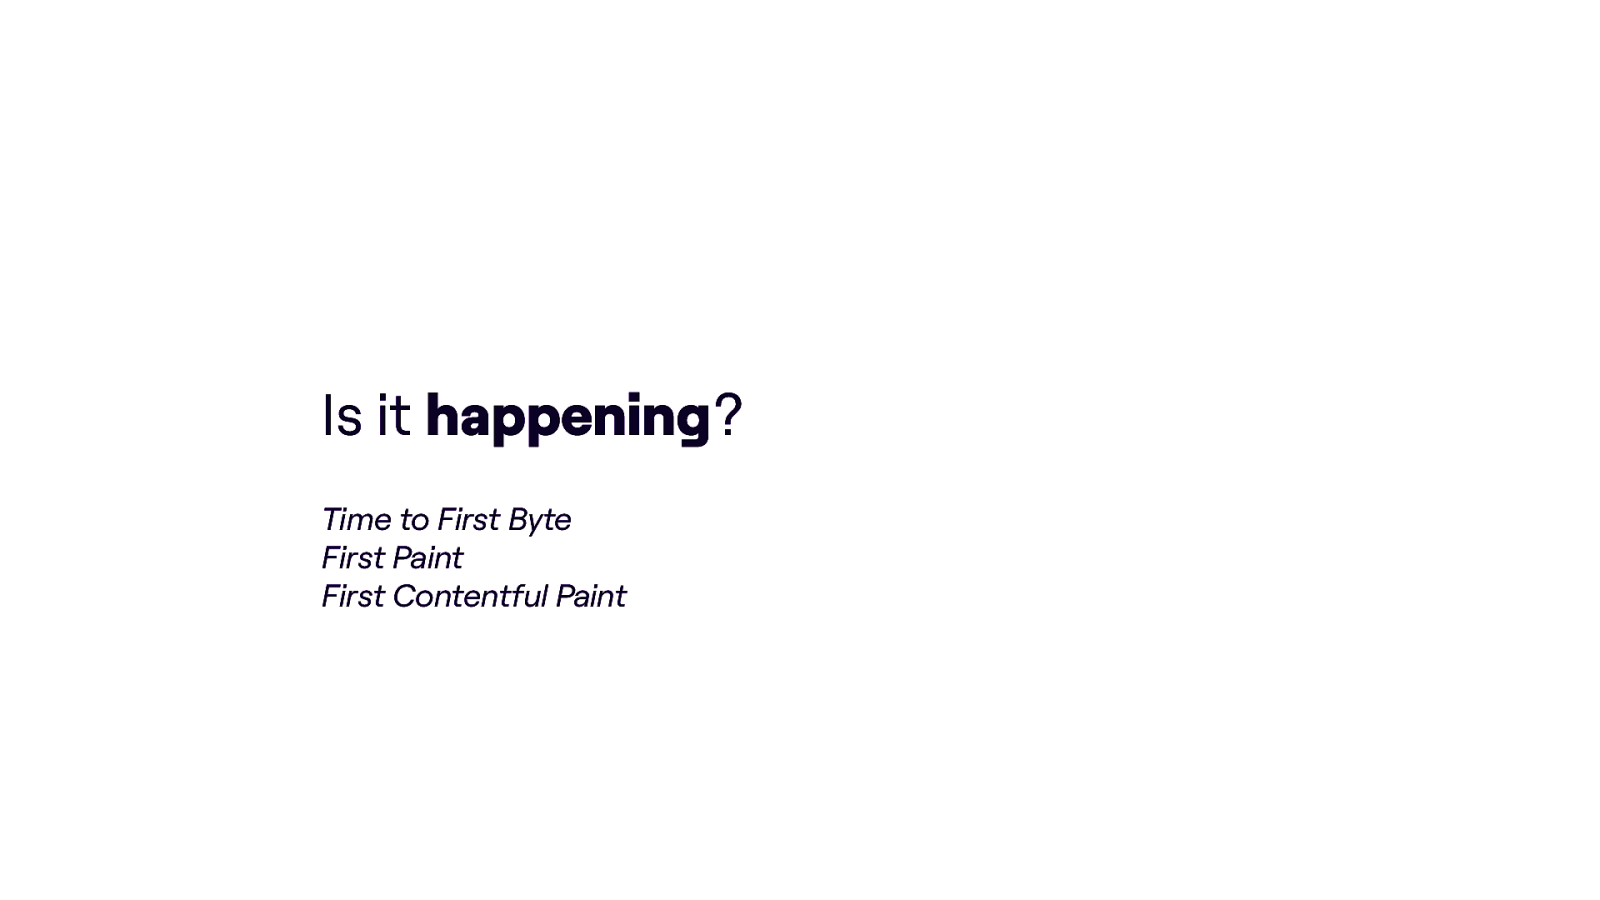
Is it happening? Time to First Byte First Paint First Contentful Paint
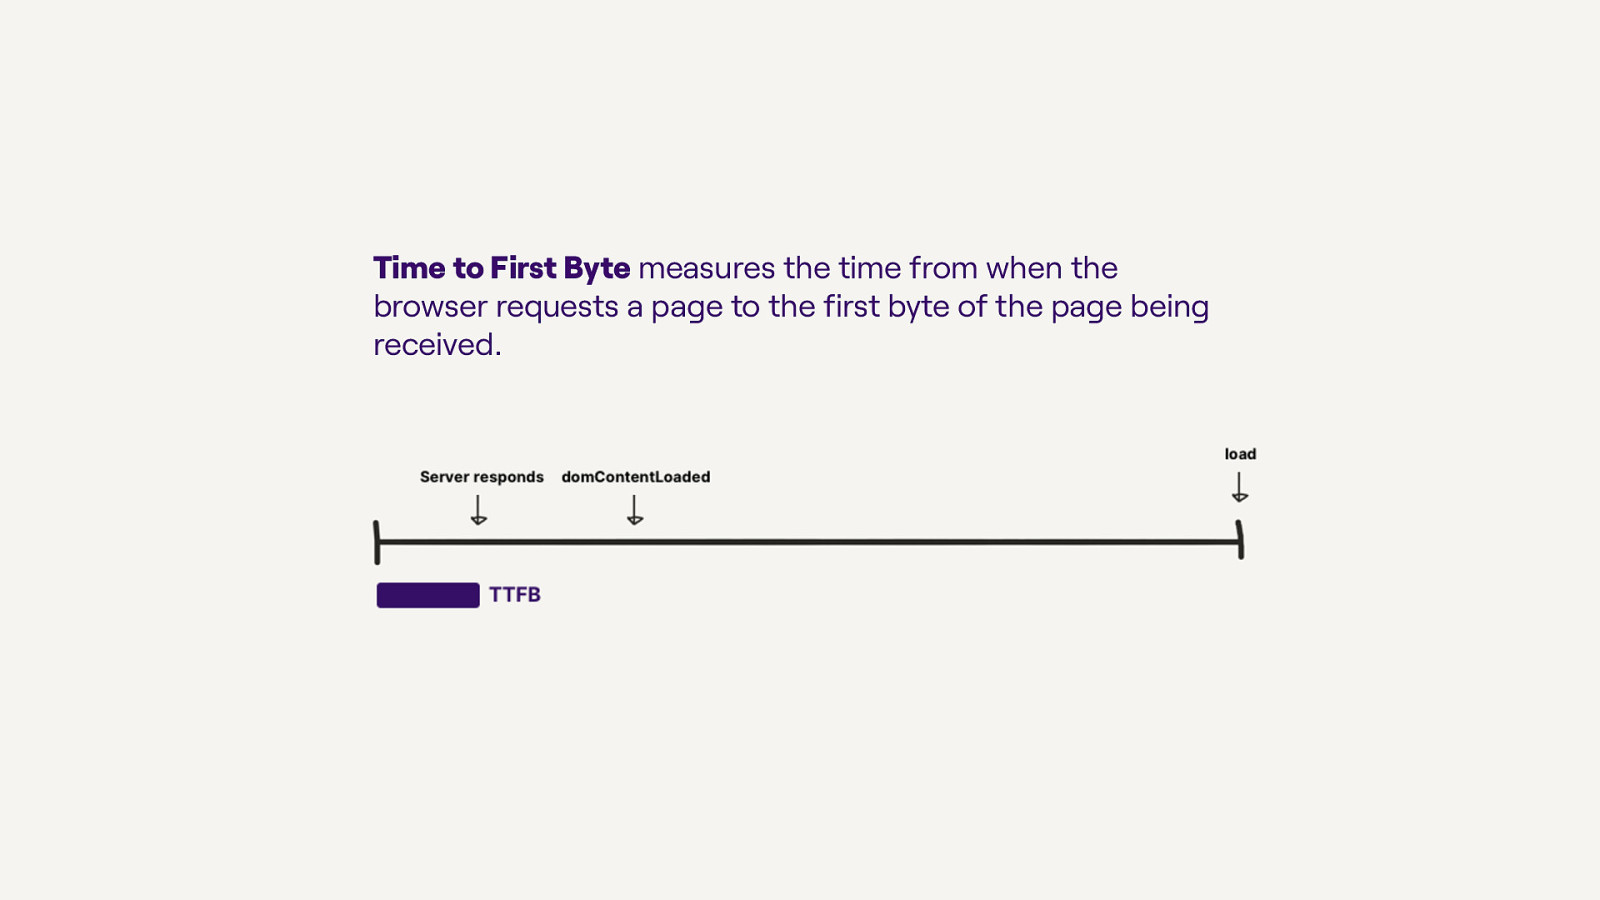
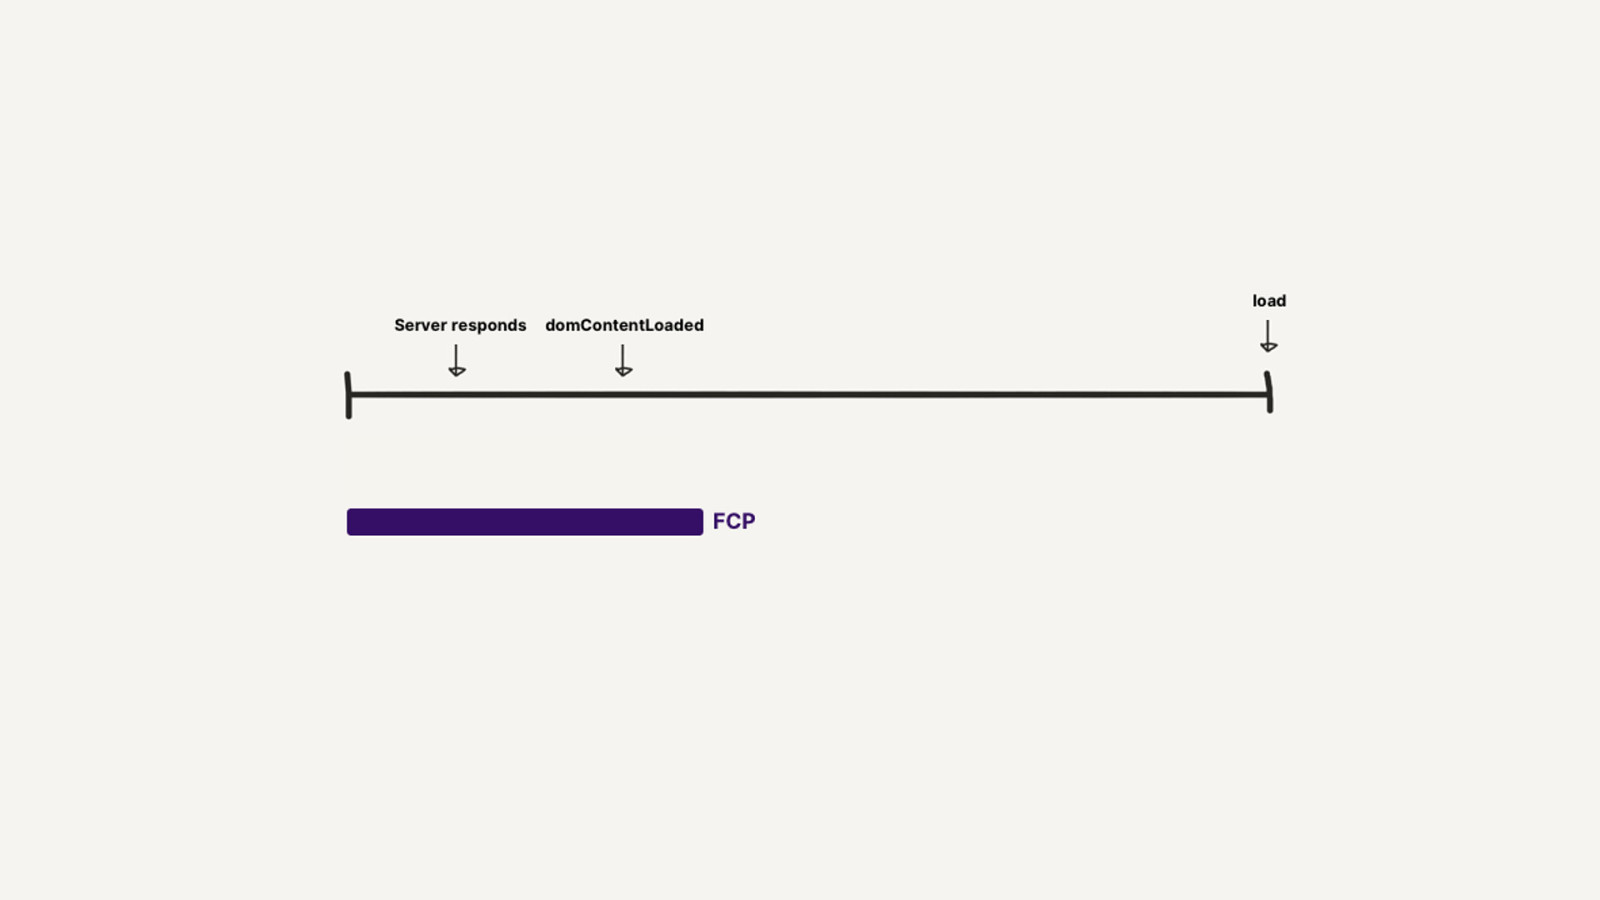
Time to First Byte measures the time from when the browser requests a page to the first byte of the page being received.
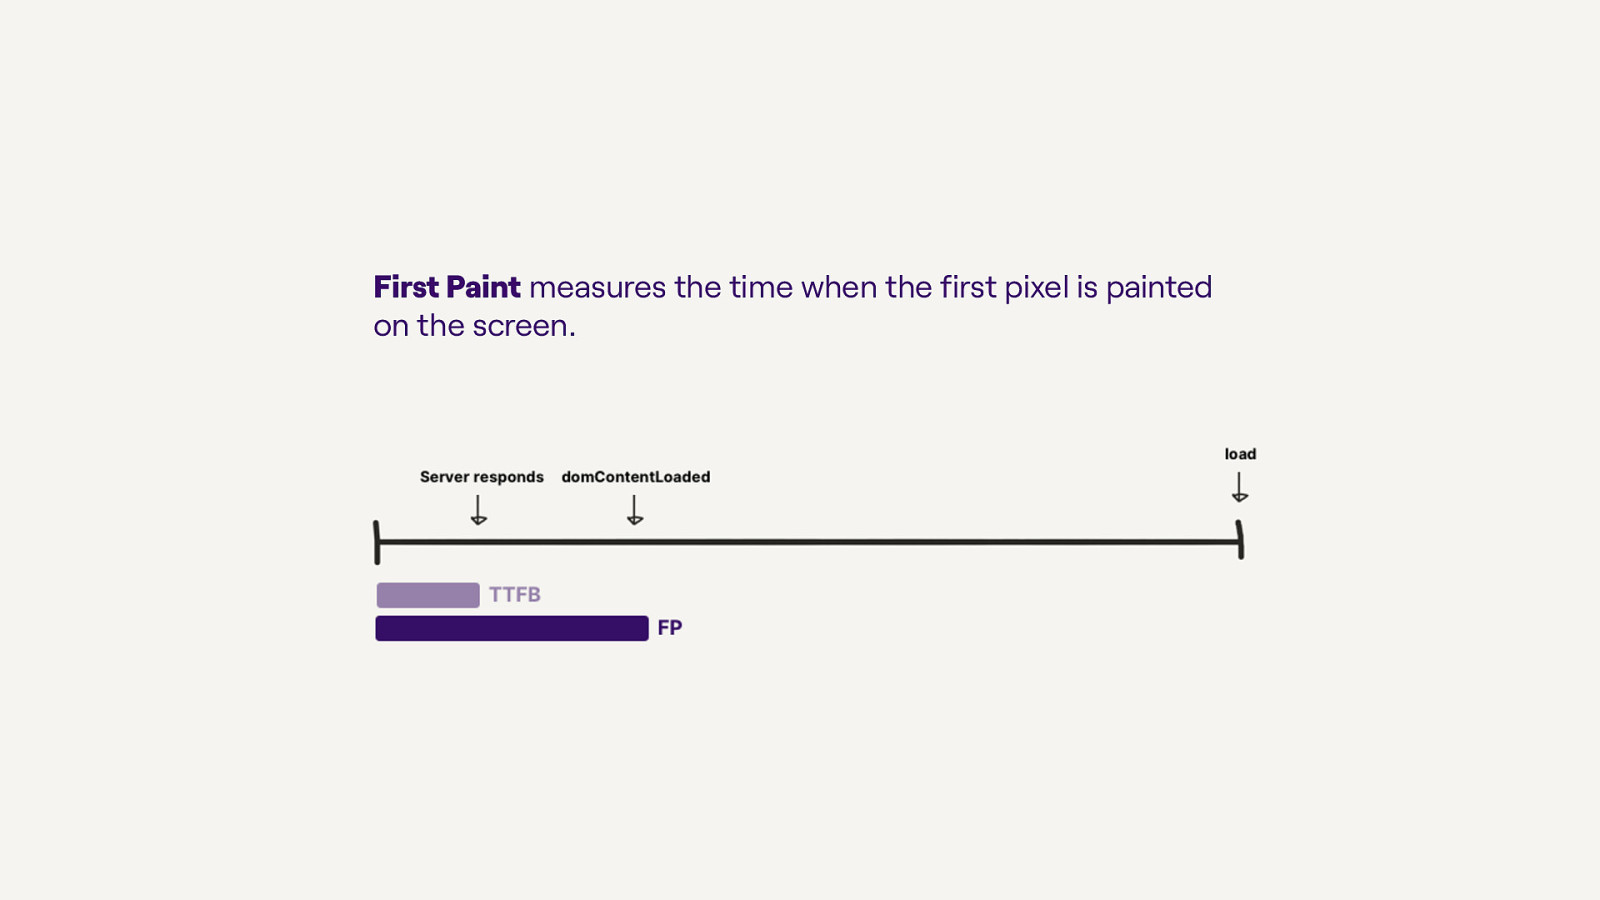
First Paint measures the time when the first pixel is painted on the screen.
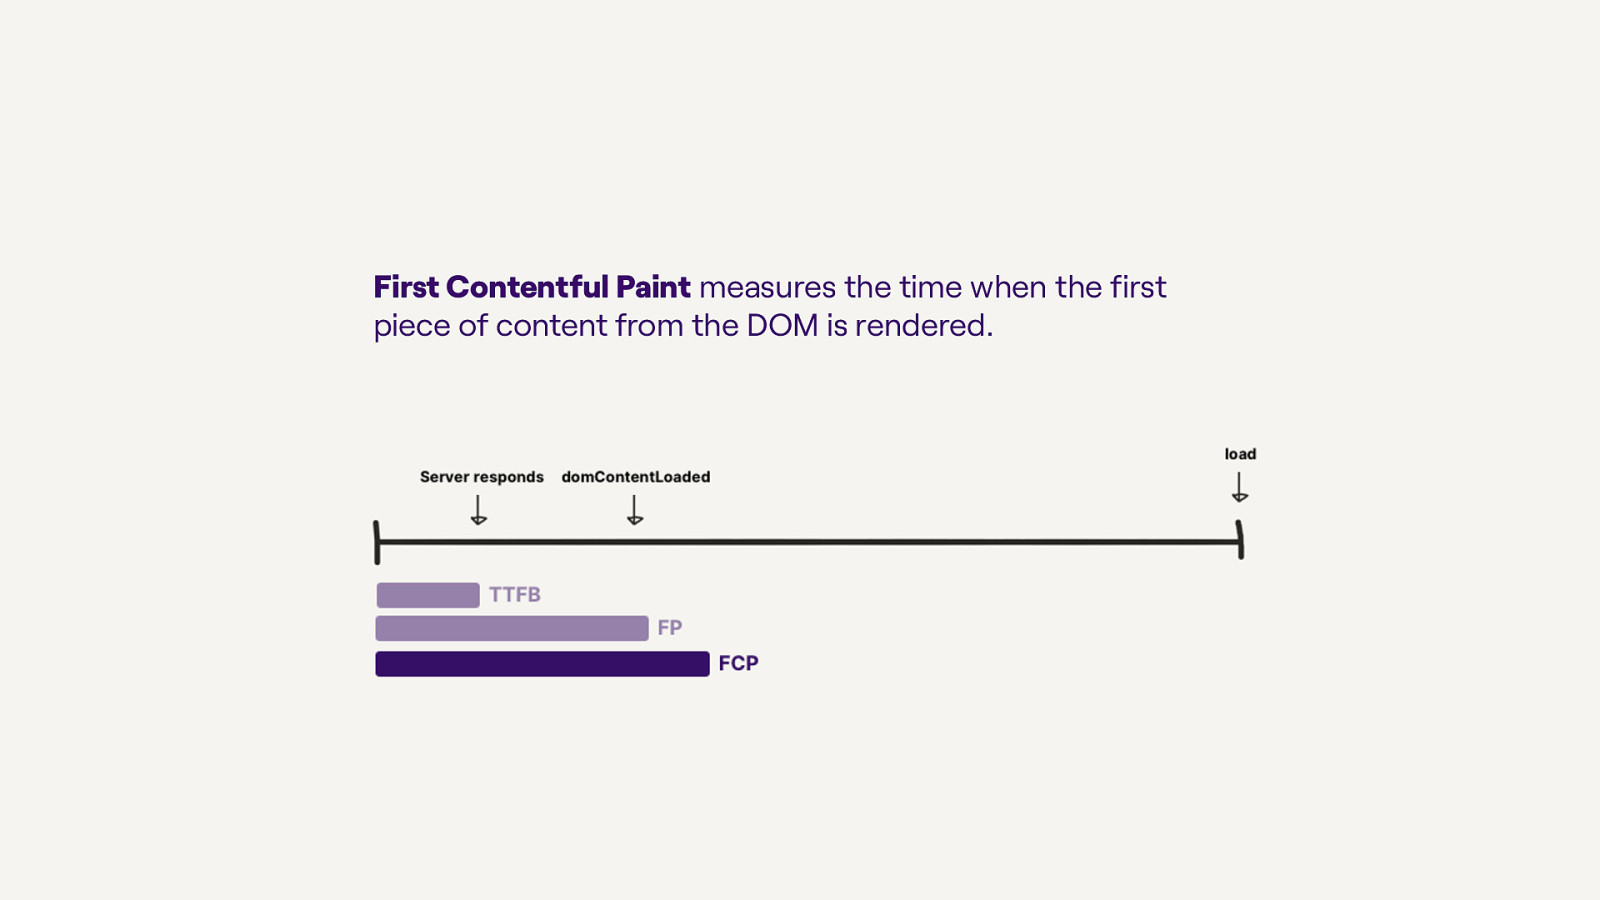
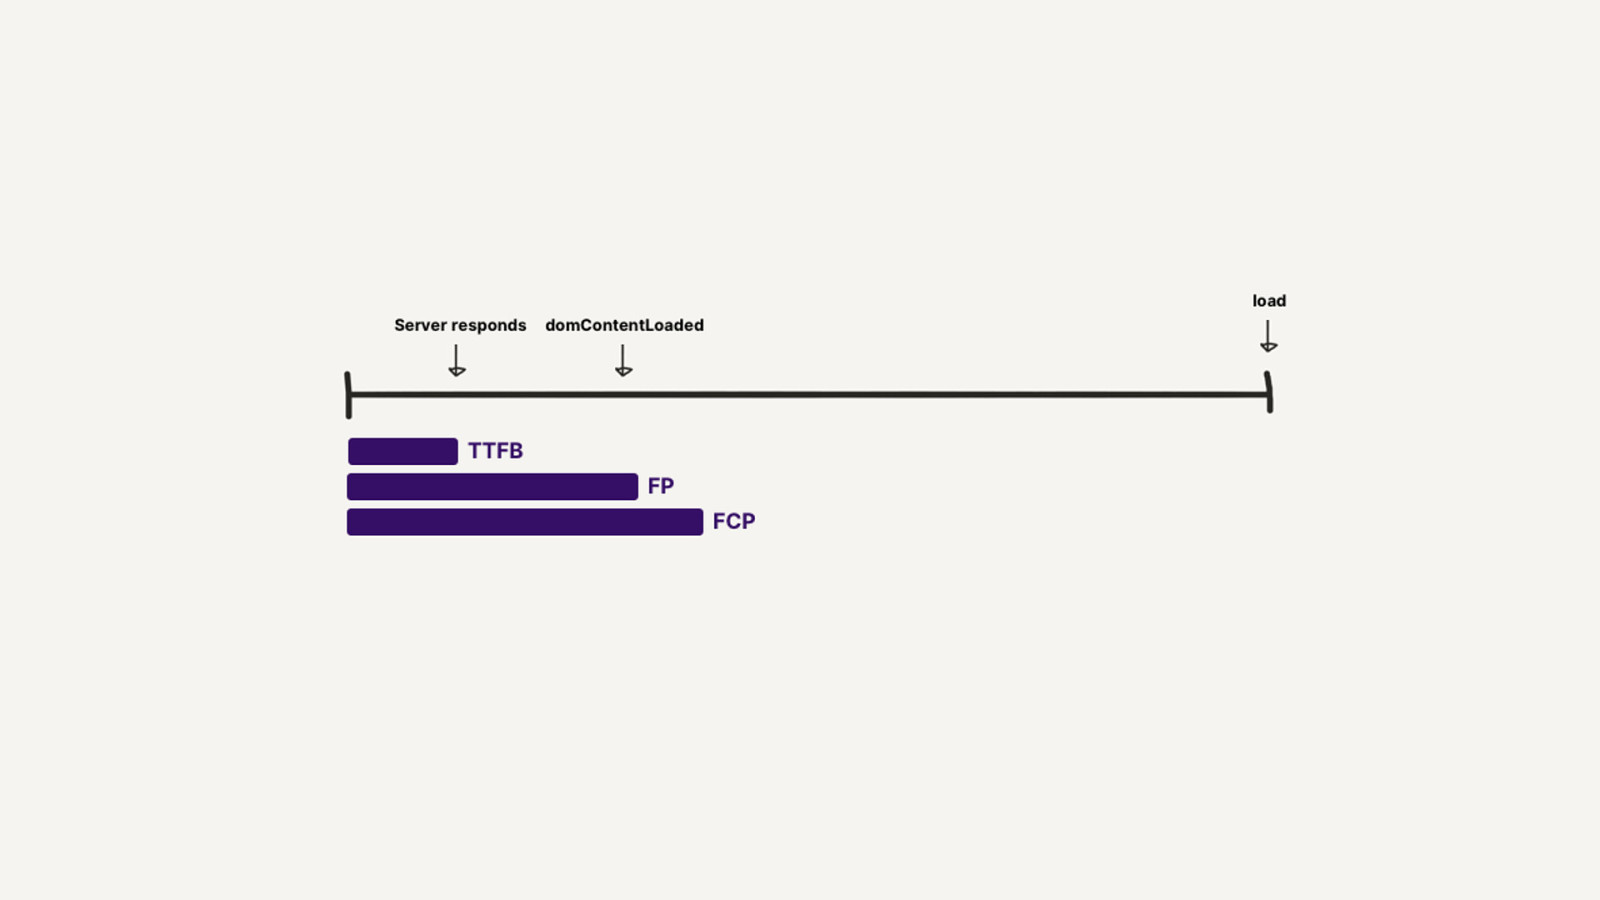
First Contentful Paint measures the time when the first piece of content from the DOM is rendered.

Is it useful? Largest Contentful Paint Visually Complete Speed Index
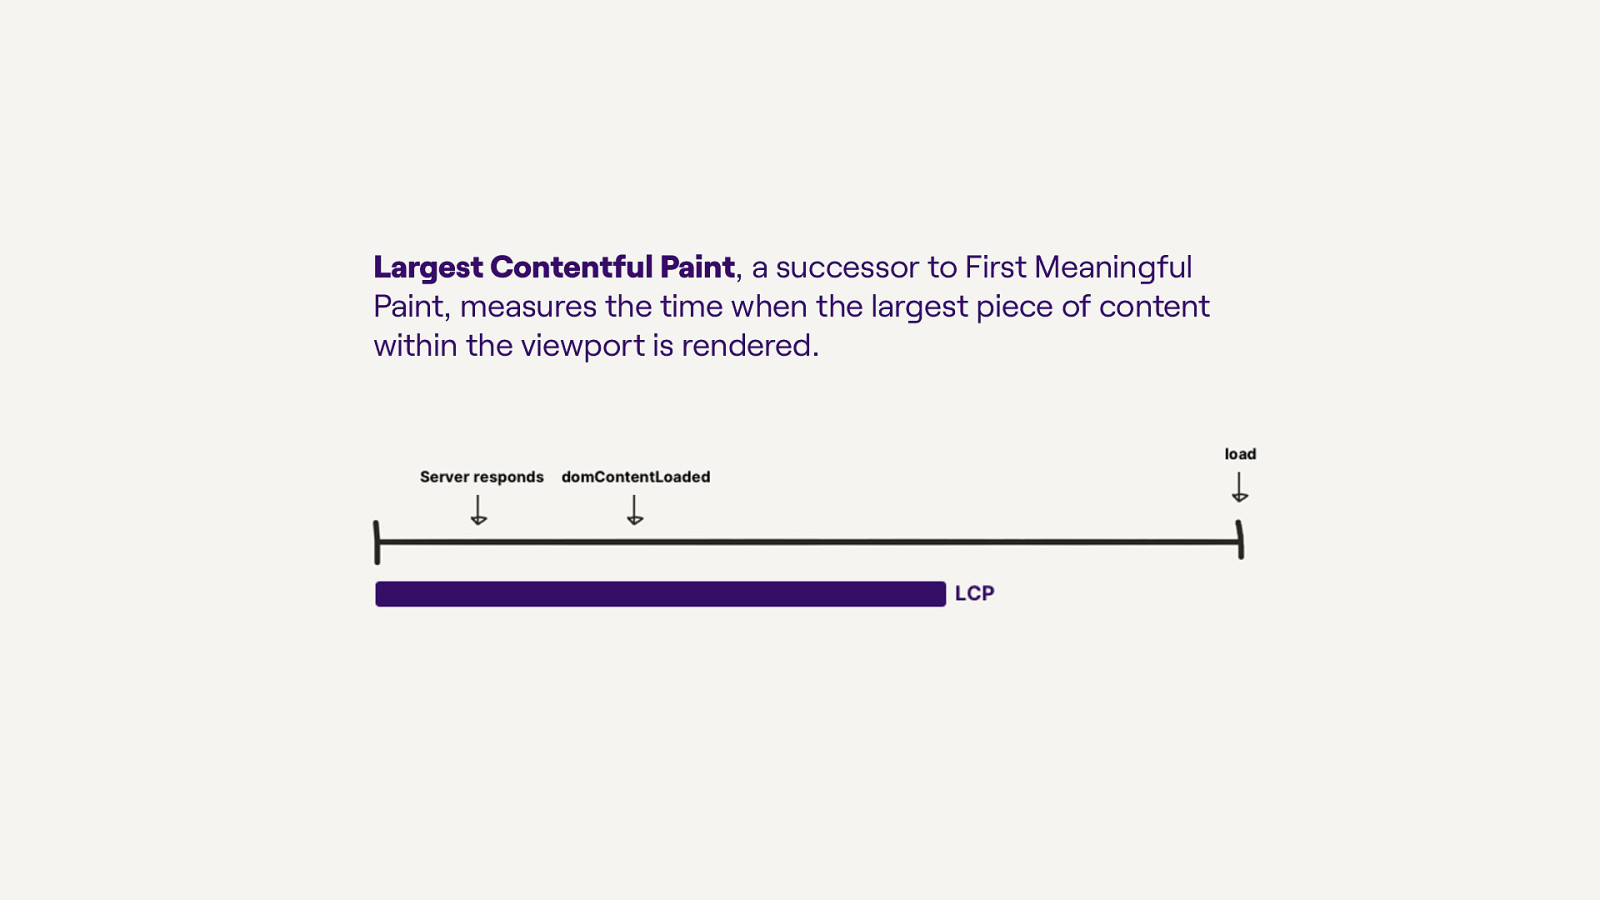
Largest Contentful Paint, a successor to First Meaningful Paint, measures the time when the largest piece of content within the viewport is rendered.
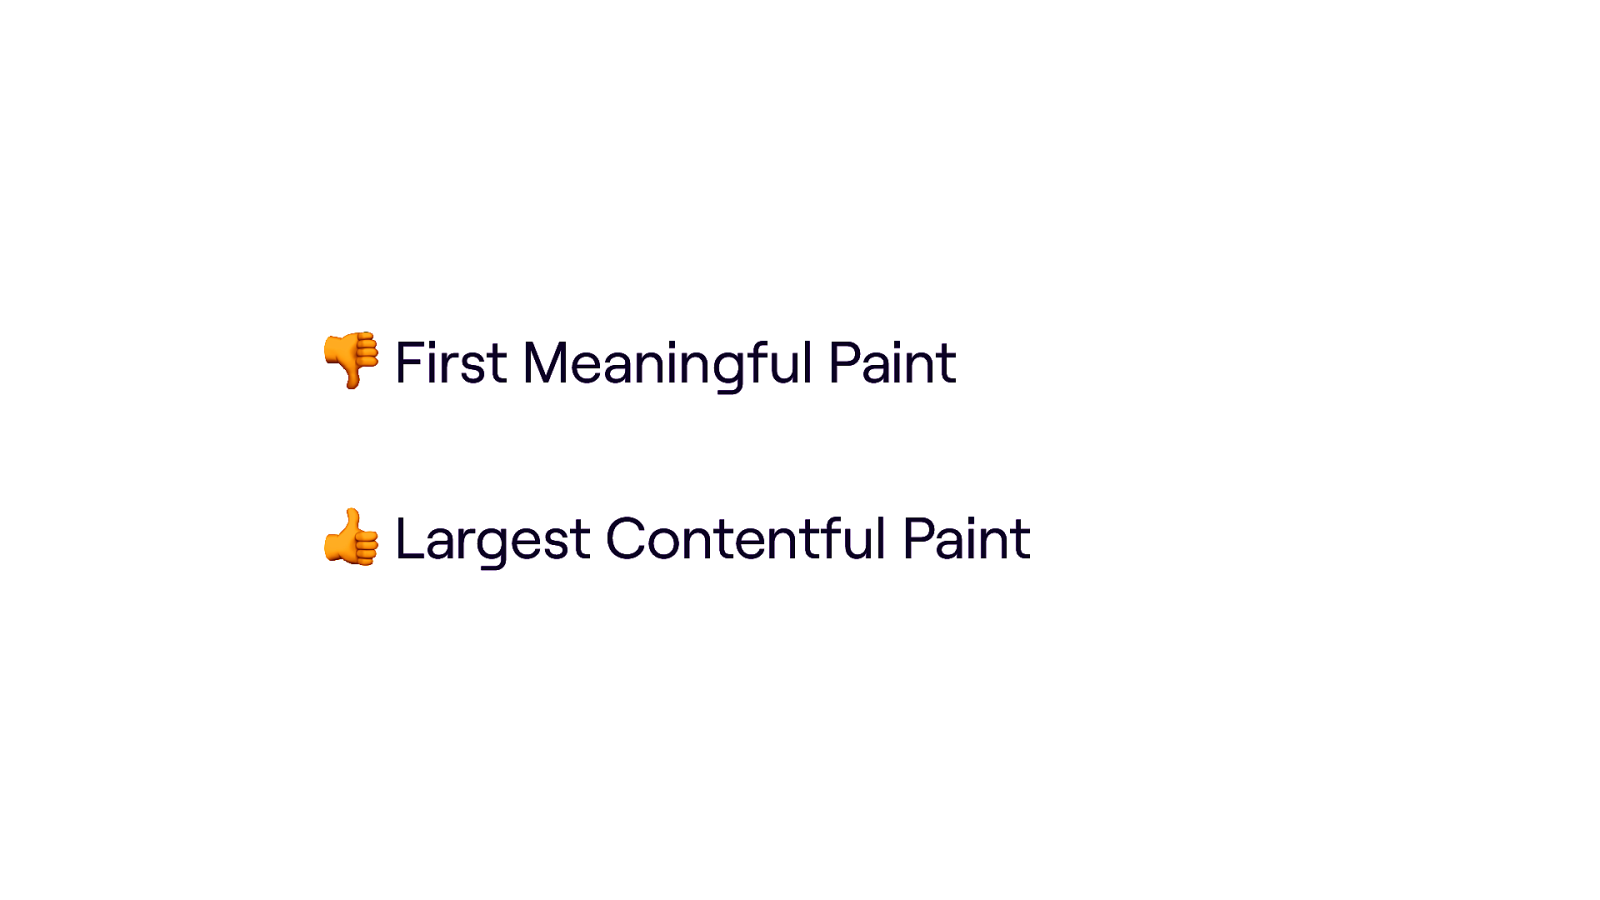
👎 First Meaningful Paint 👍 Largest Contentful Paint
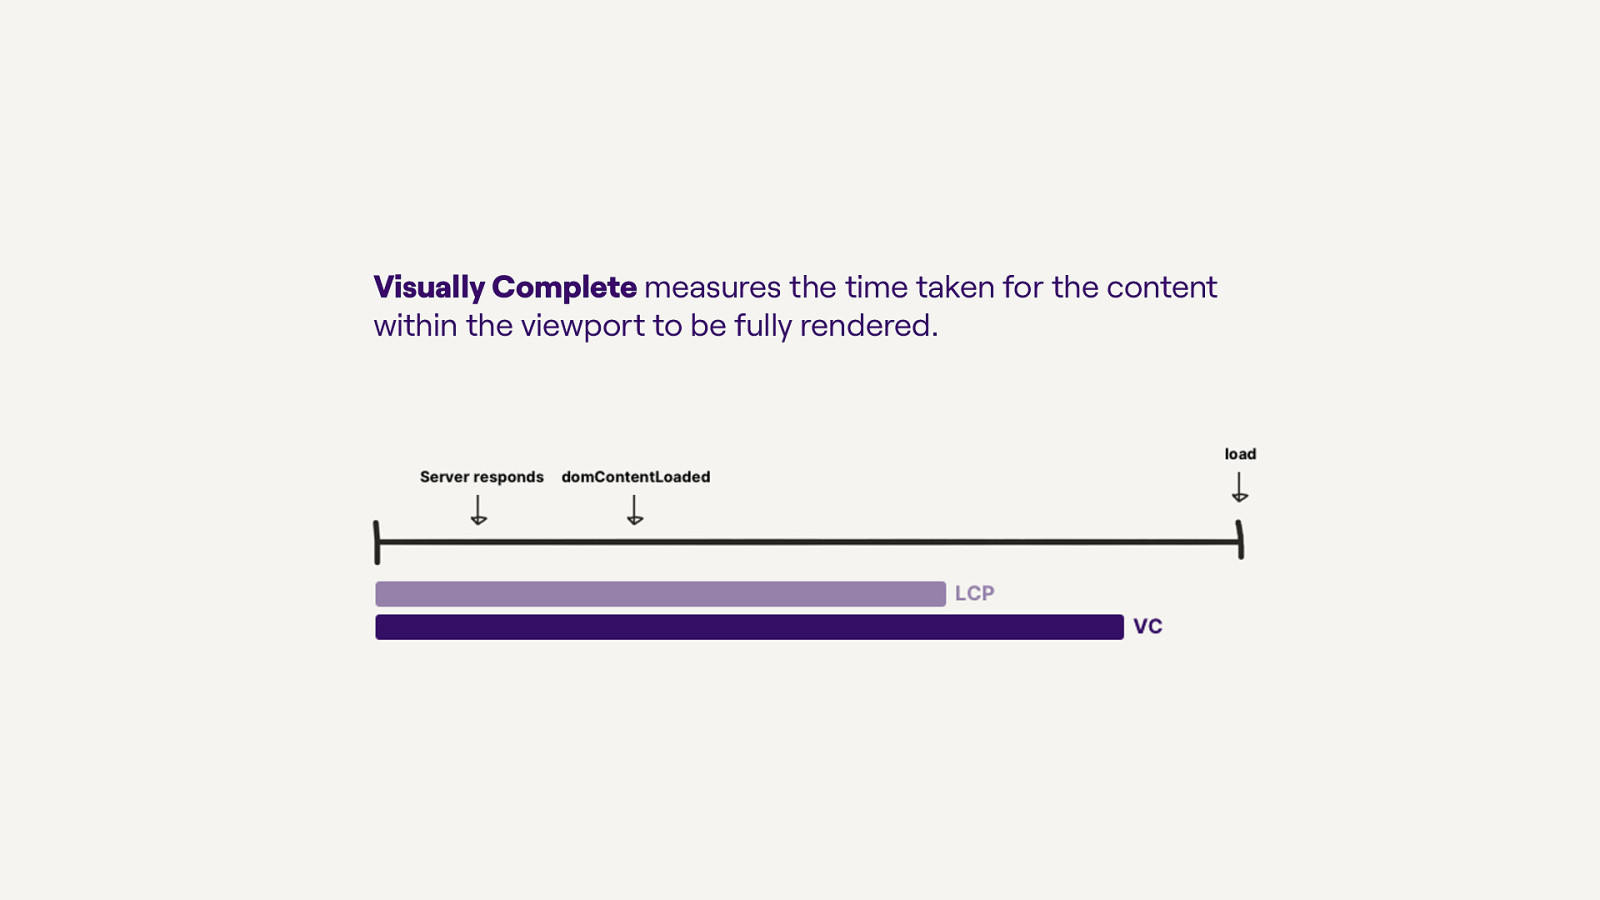
Visually Complete measures the time taken for the content within the viewport to be fully rendered.
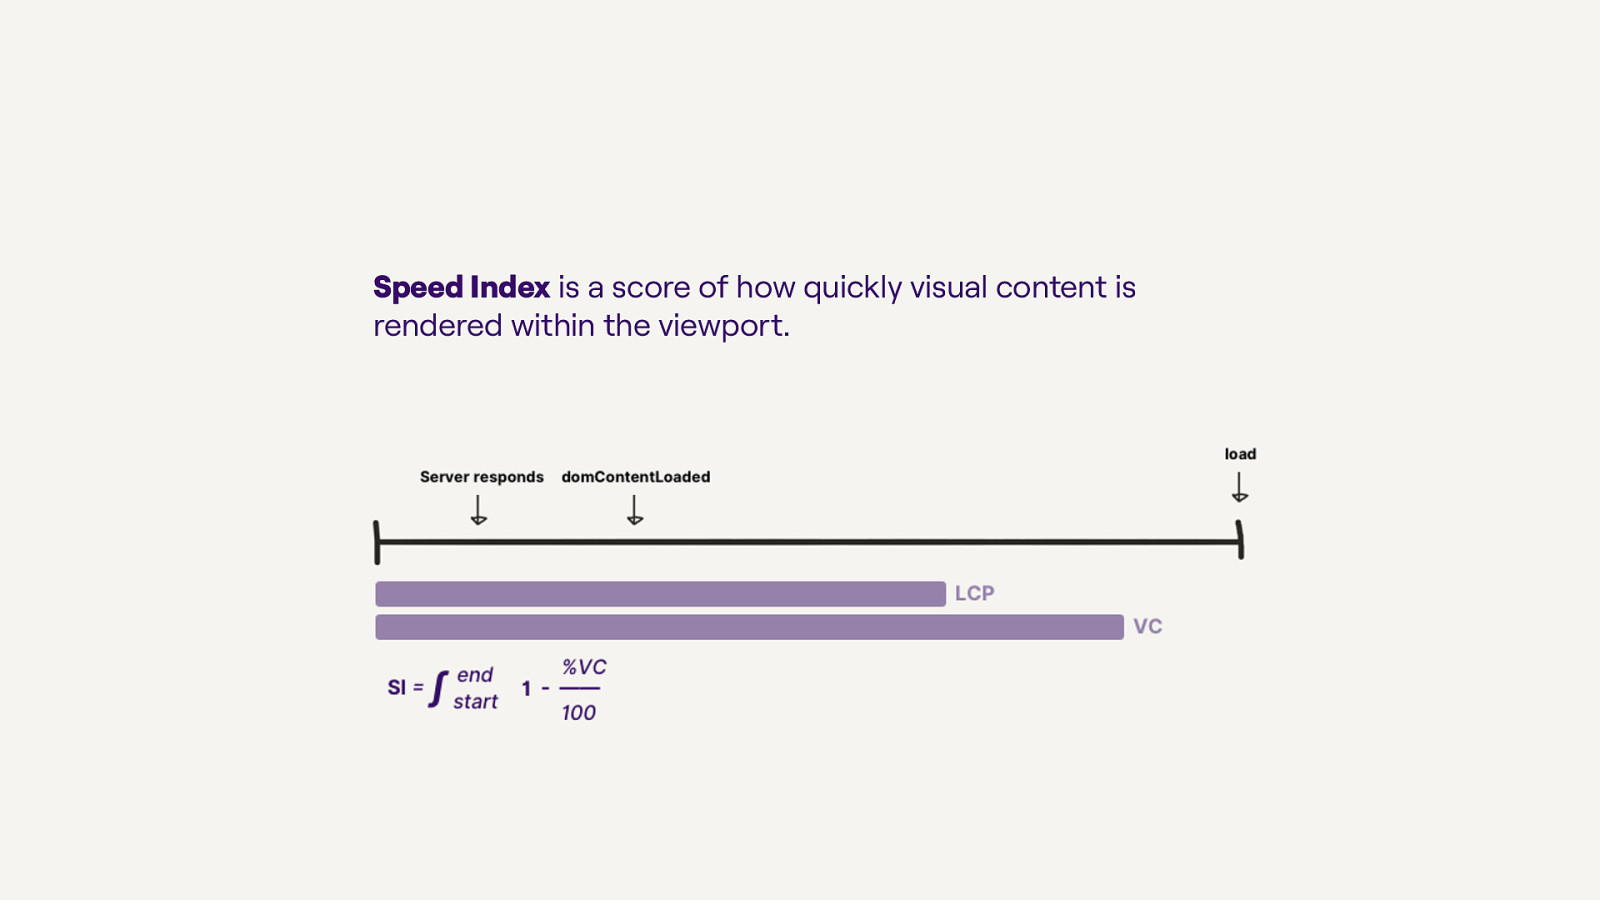
Speed Index is a score of how quickly visual content is rendered within the viewport.
Is it usable? First Input Delay & Max Potential First Input Delay Total Blocking Time Time to Interactive
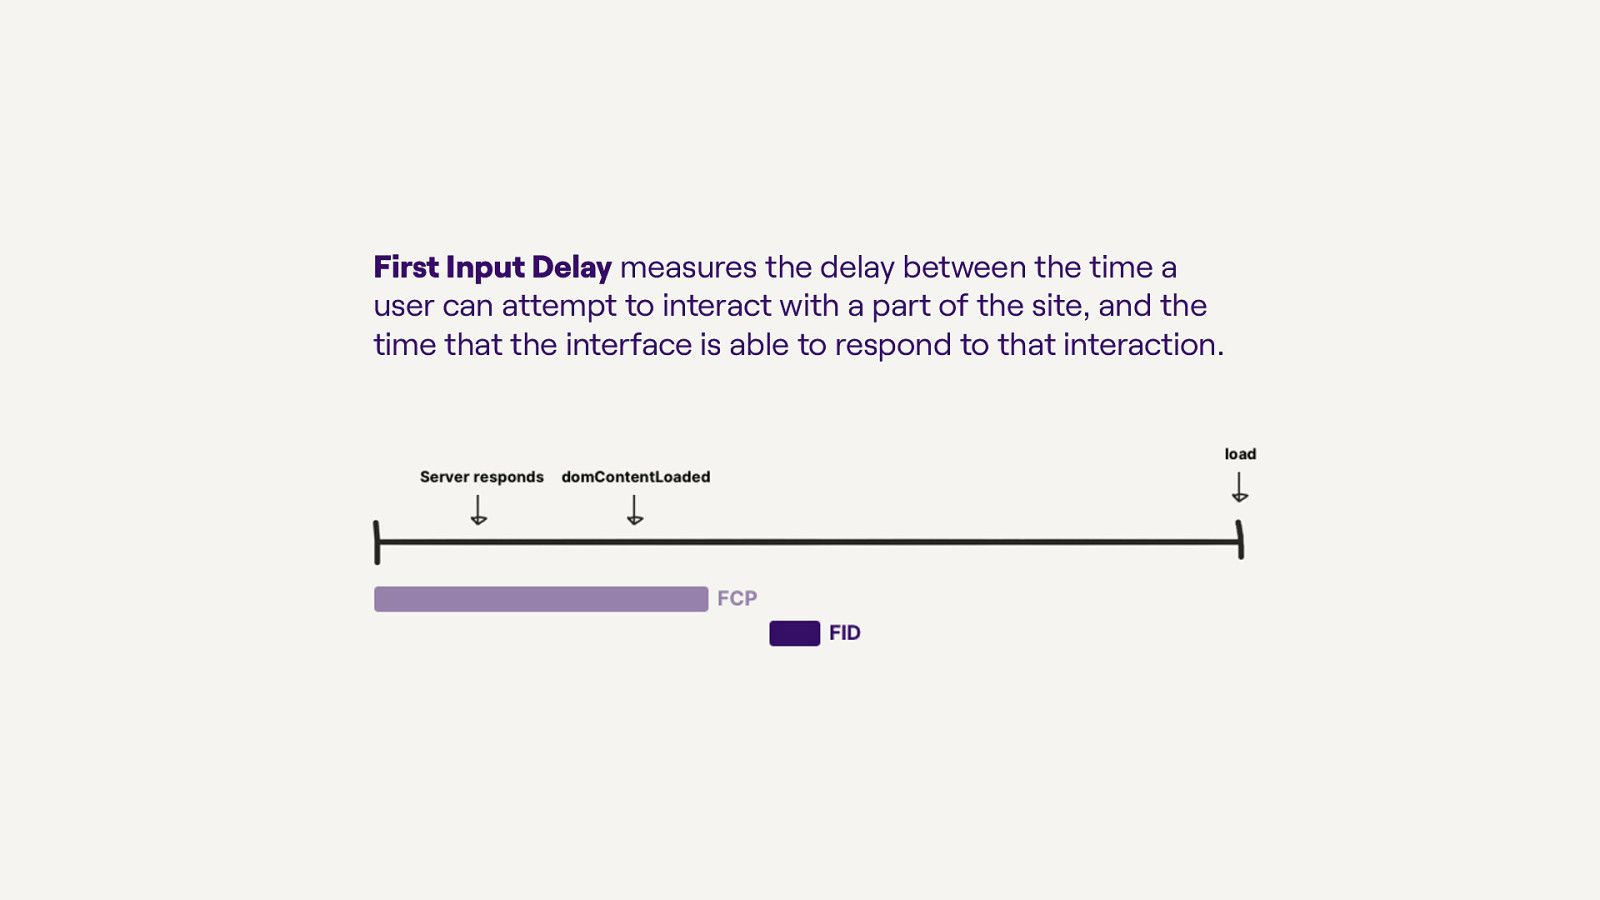
First Input Delay measures the delay between the time a user can attempt to interact with a part of the site, and the time that the interface is able to respond to that interaction.
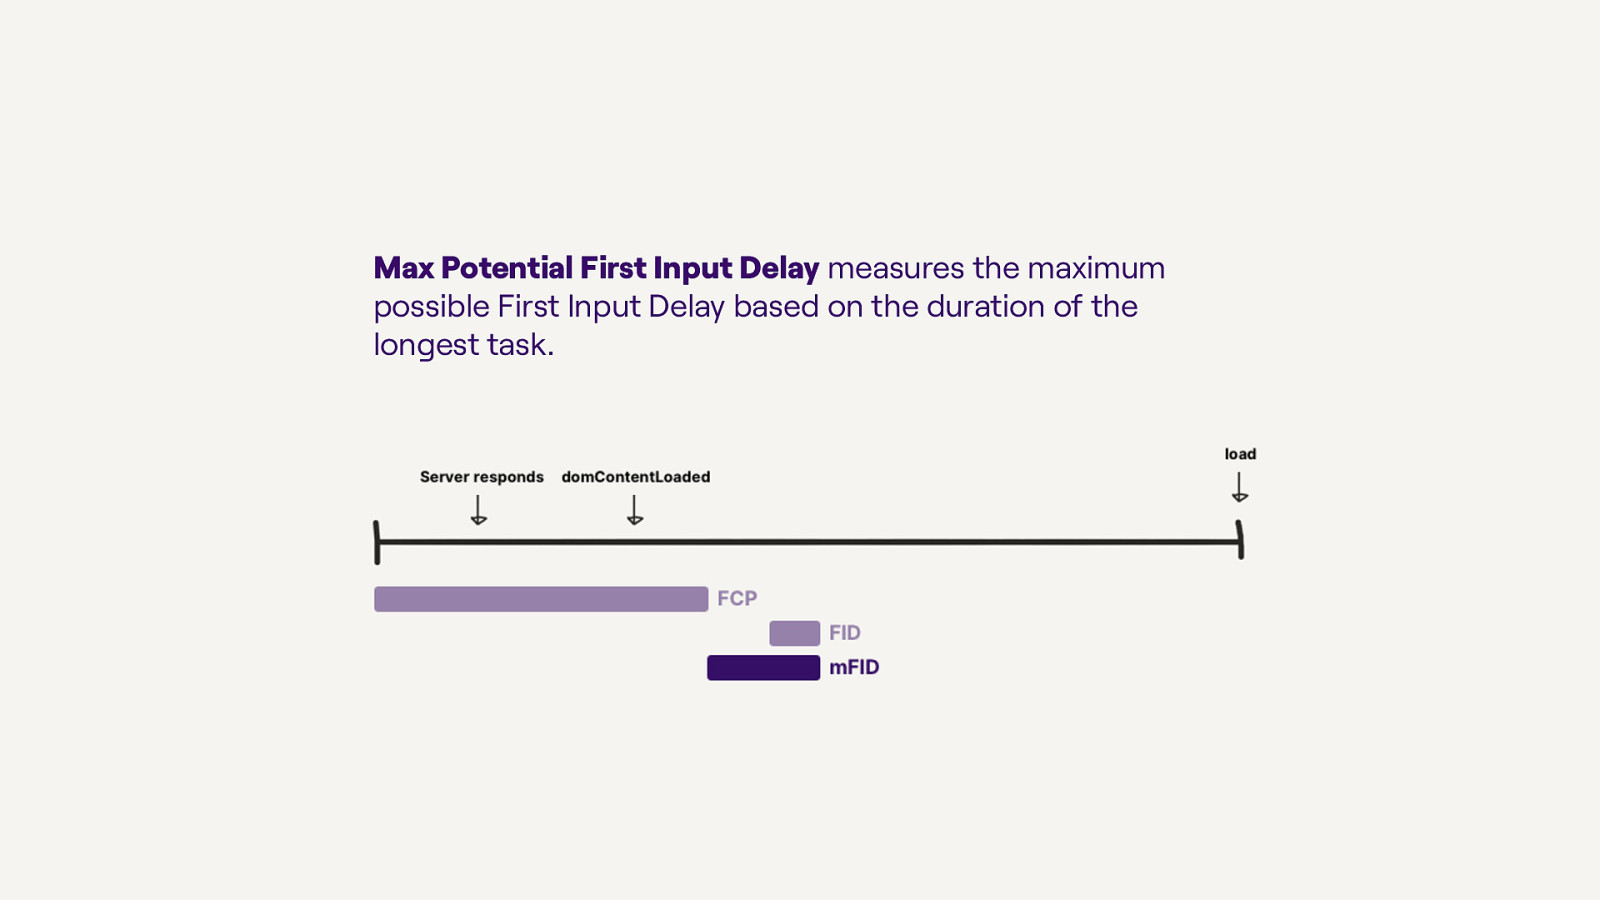
Max Potential First Input Delay measures the maximum possible First Input Delay based on the duration of the longest task.
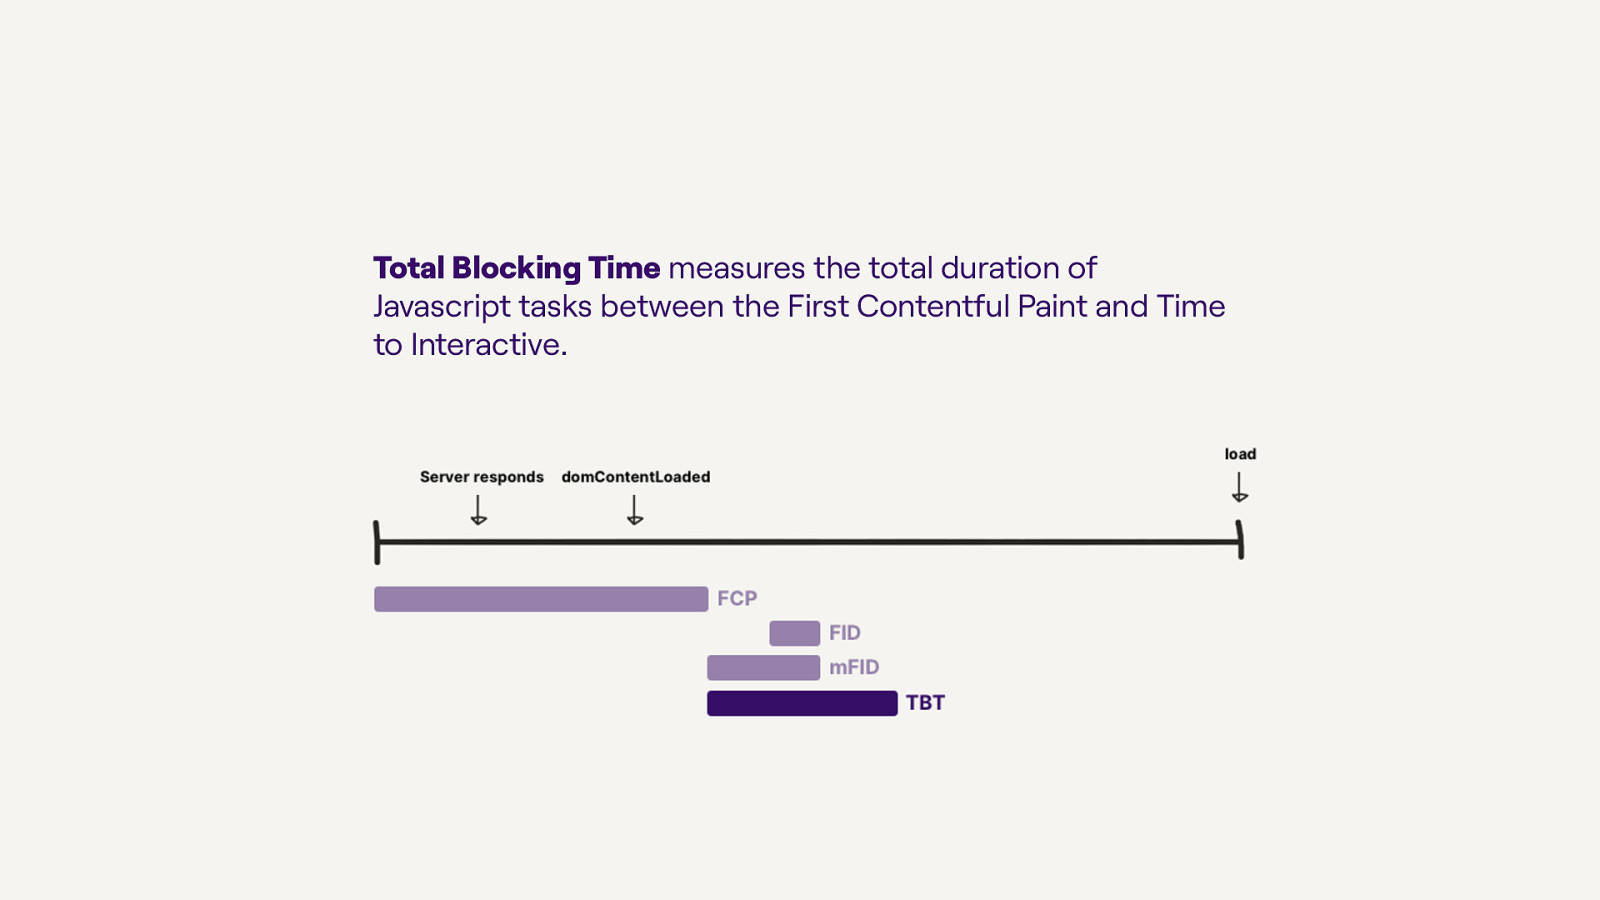
Total Blocking Time measures the total duration of Javascript tasks between the First Contentful Paint and Time to Interactive.
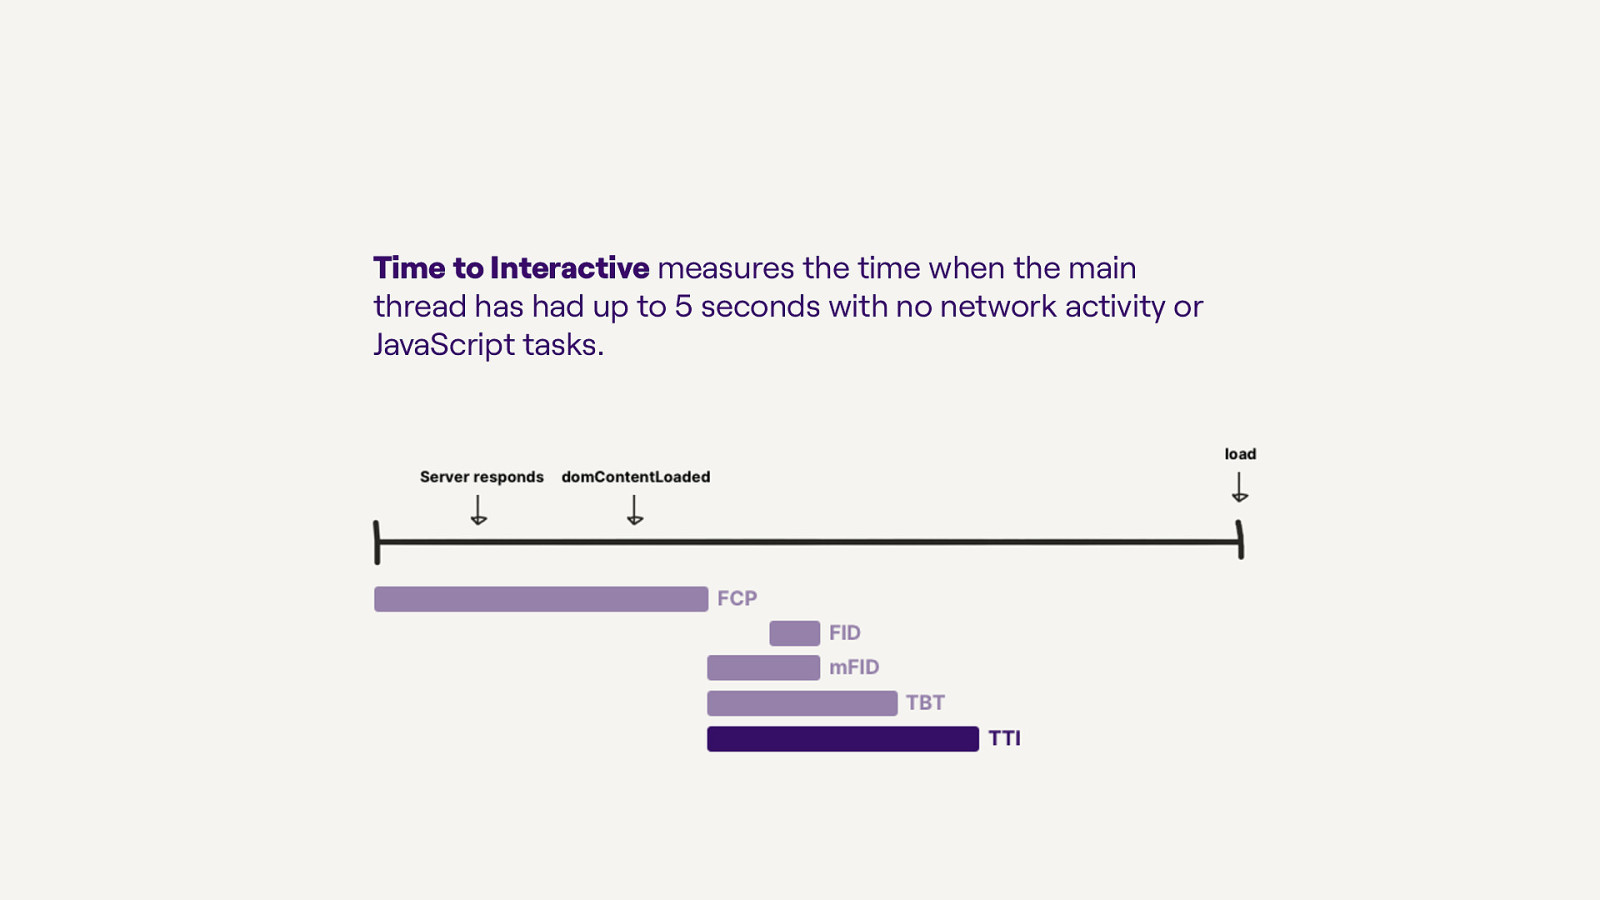
Time to Interactive measures the time when the main thread has had up to 5 seconds with no network activity or JavaScript tasks.

Is it delightful? Cumulative Layout Shift Frame Rate
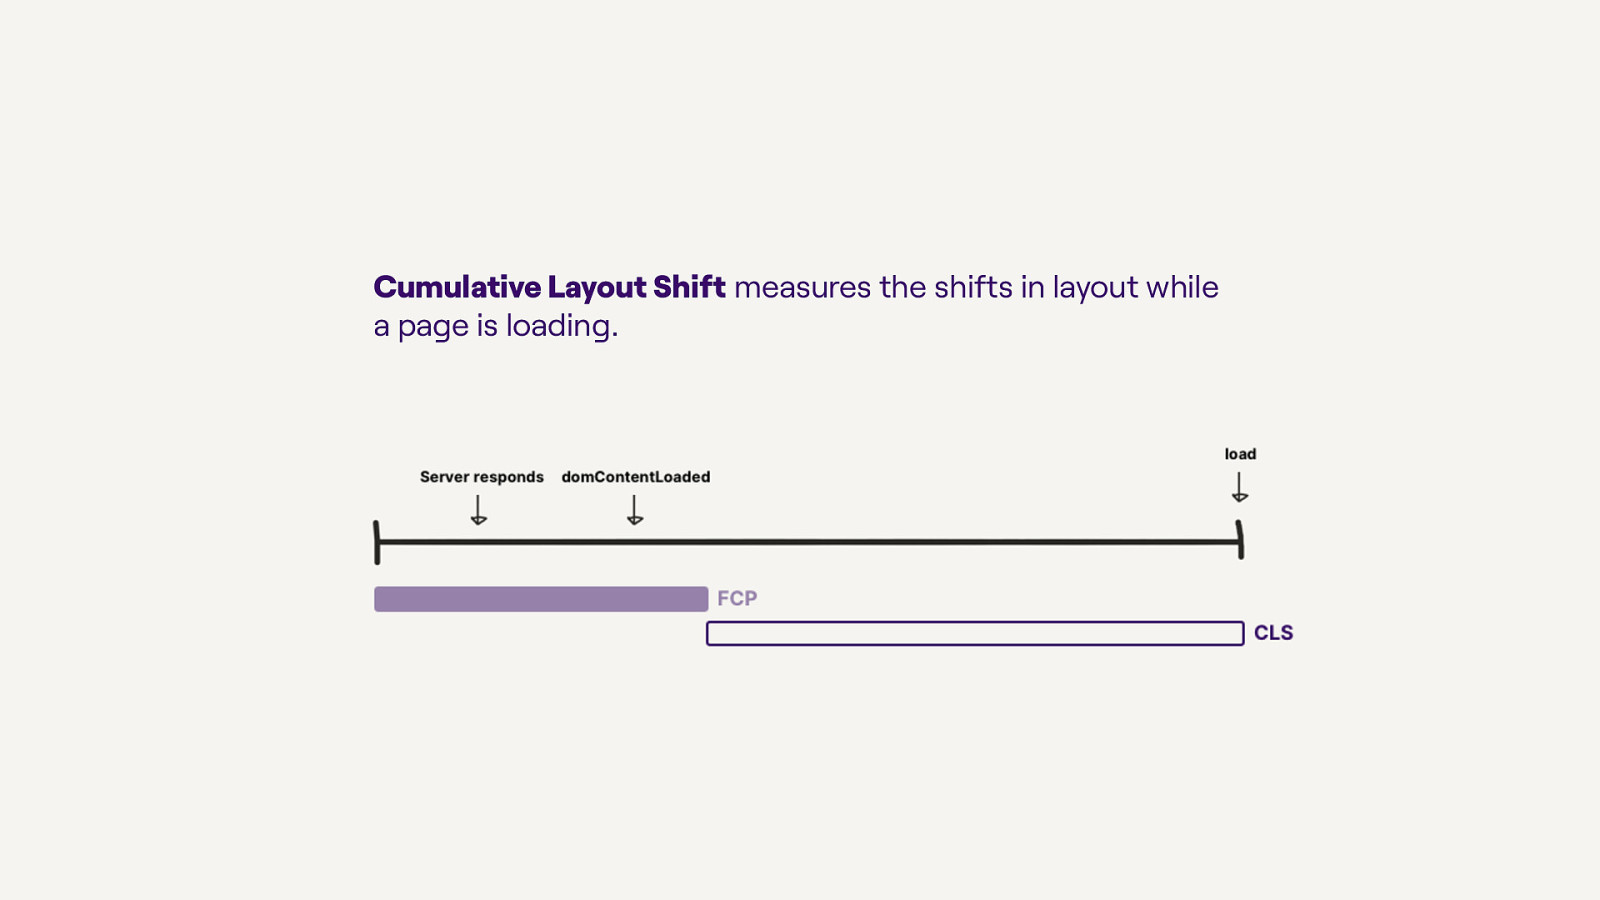
Cumulative Layout Shift measures the shifts in layout while a page is loading.

web.dev/cls
Frame rate is the rate at which the browser can produce new frames in response to interactions and/or animations.

jakearchibald.github.io/jank-invaders

Max Potential First Input Delay Largest Contentful Paint First Paint First Input Delay Total Blocking Time First Contentful Paint Time to Interactive First Meaningful Paint Visually Complete Cumulative Layout Shift Time to First Byte

Which metrics do I start with?

Start general, then dig deeper if needed
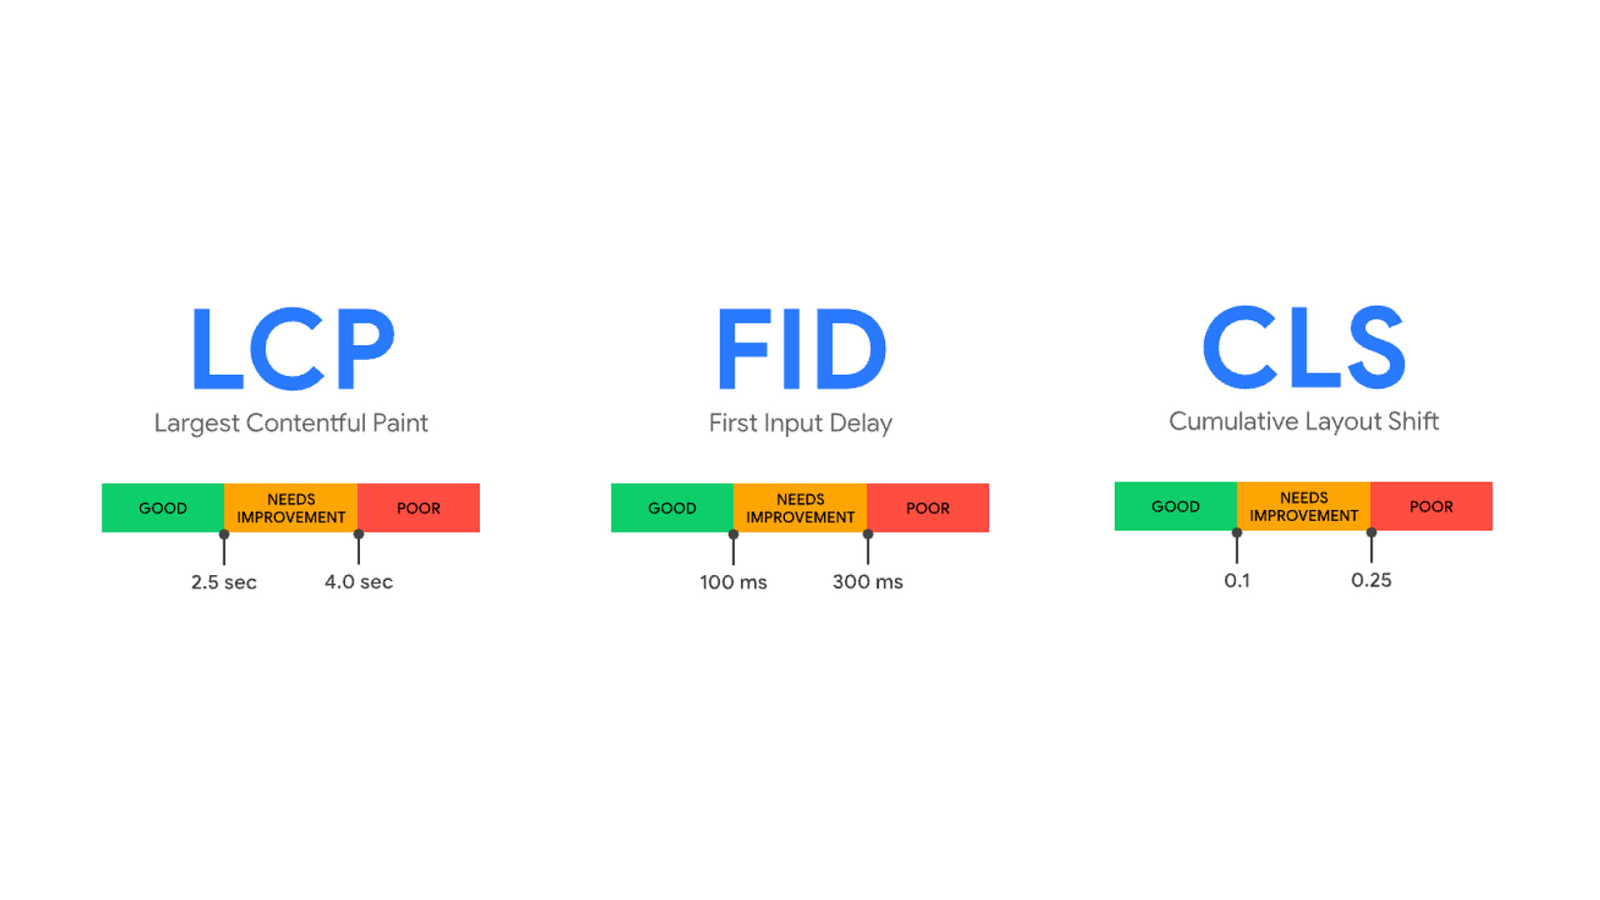
Core Web Vitals https://web.dev/vitals
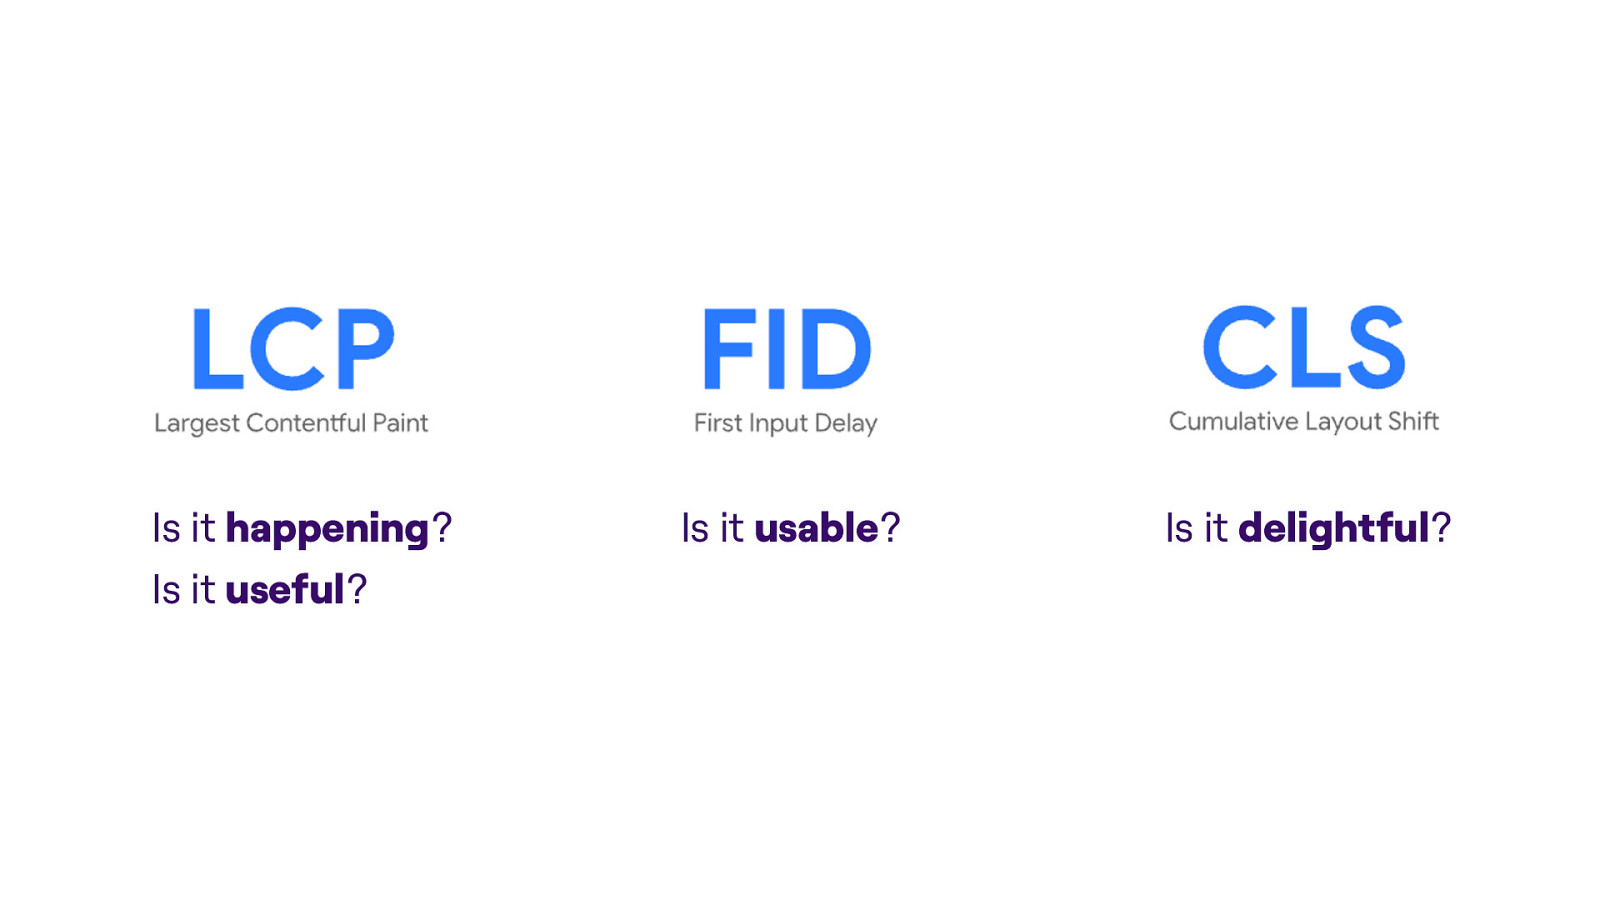
Is it happening? Is it useful? Is it usable? Is it delightful?
Largest Contentful Paint Cumulative Layout Shift First Input Delay
What does performant actually mean for your site?

Example — Social Media Website 💬
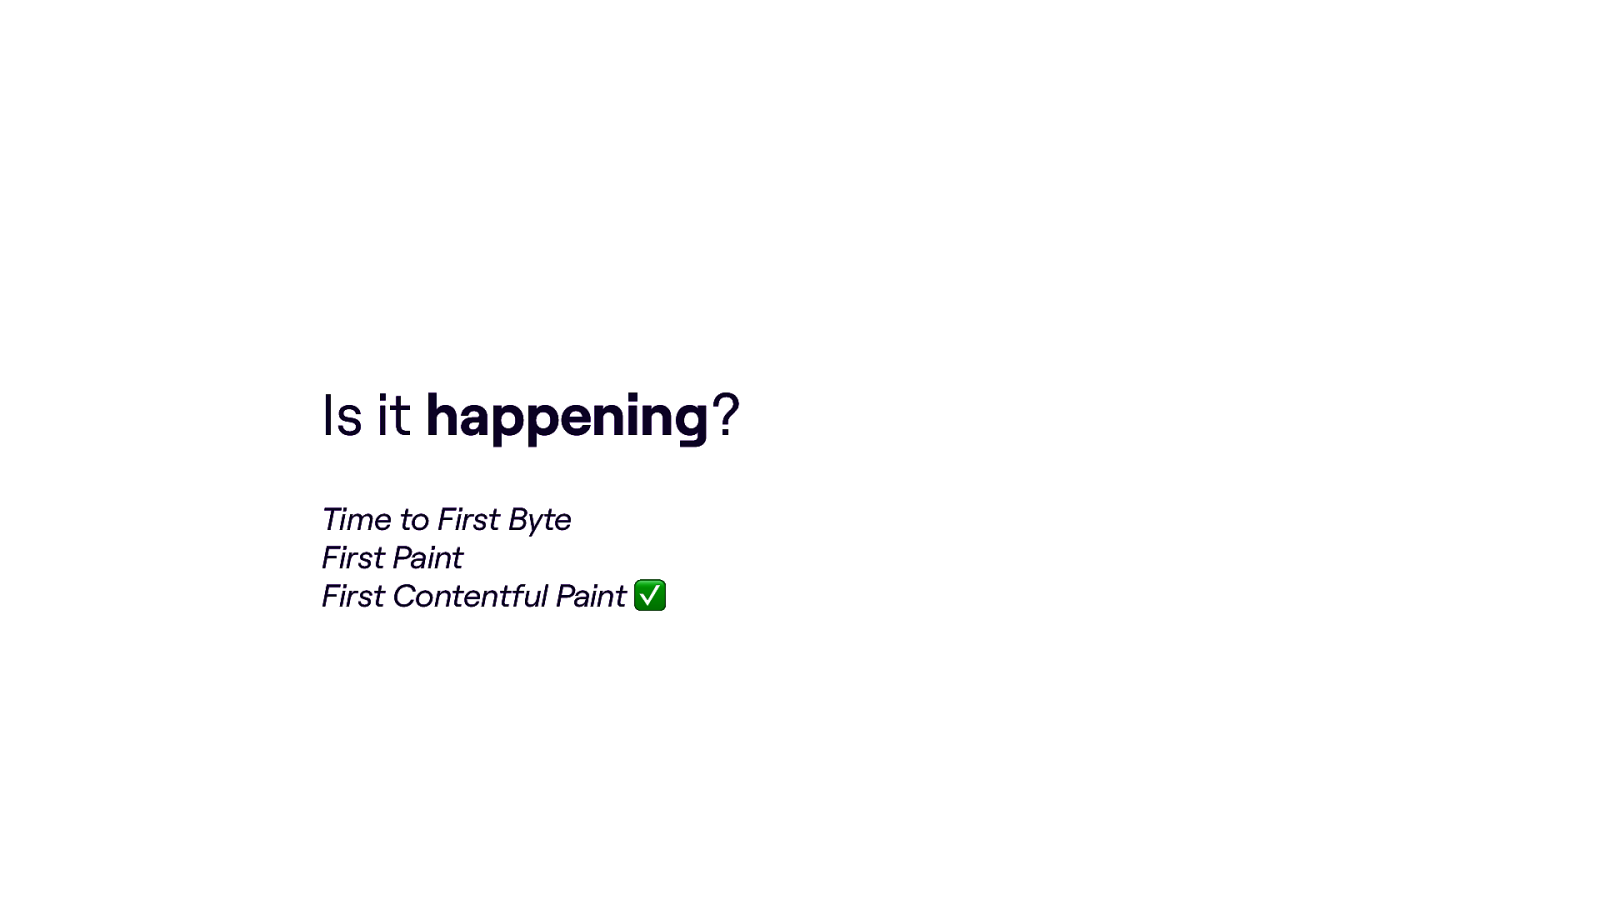
Is it happening? Time to First Byte First Paint First Contentful Paint ✅

Is it useful? Largest Contentful Paint ✅ Visually Complete Speed Index ✅
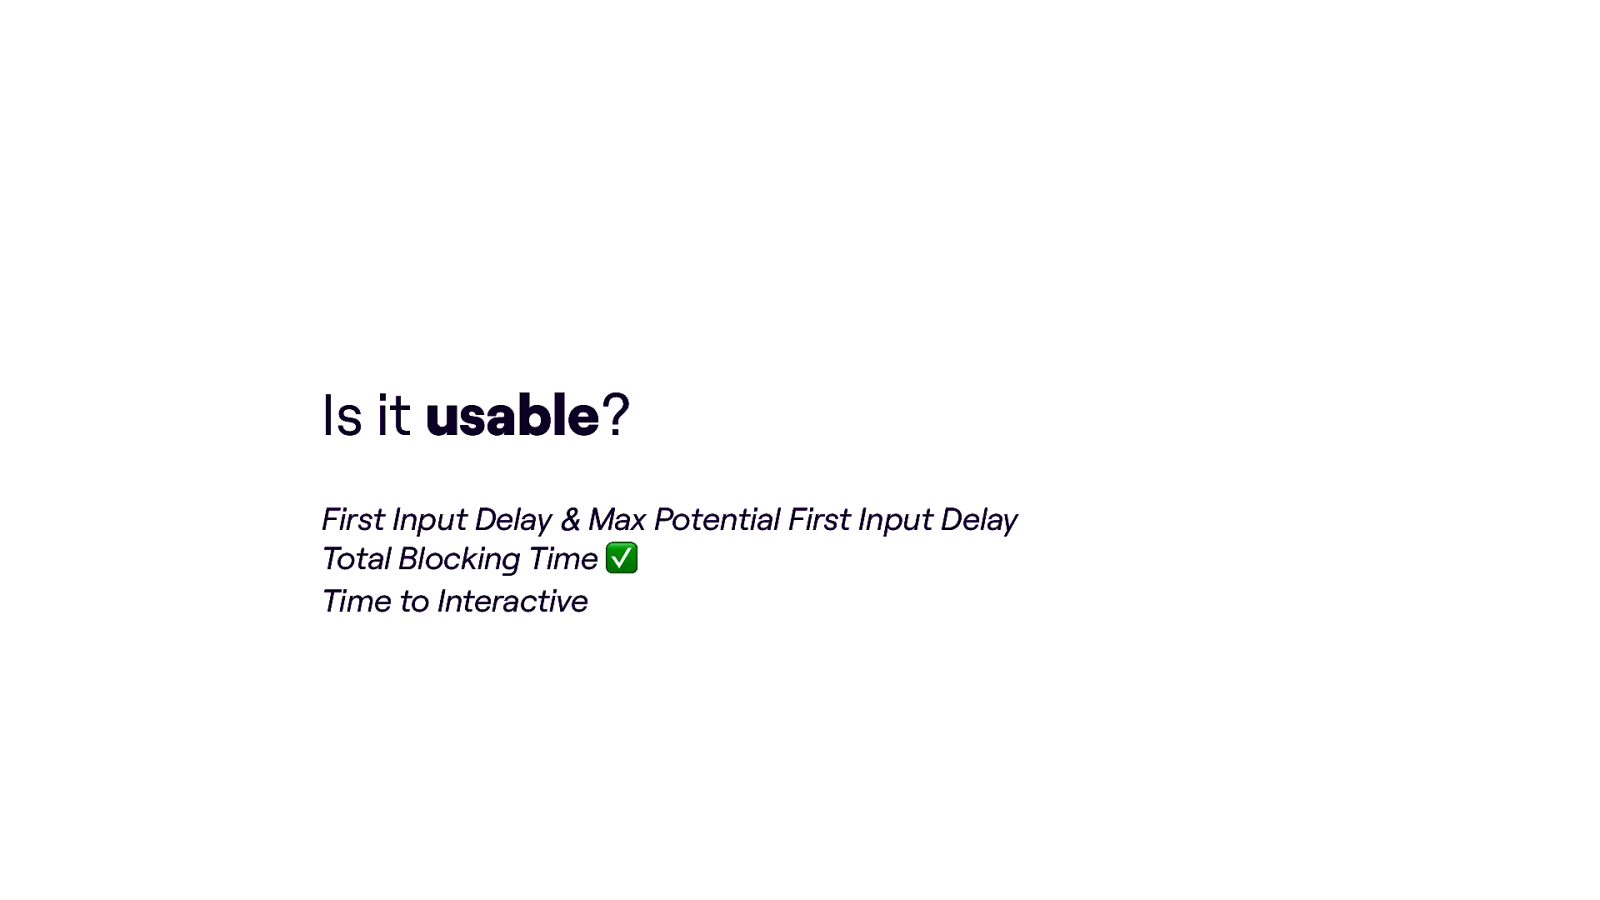
Is it usable? First Input Delay & Max Potential First Input Delay Total Blocking Time ✅ Time to Interactive

Is it delightful? Cumulative Layout Shift ✅ Frame Rate
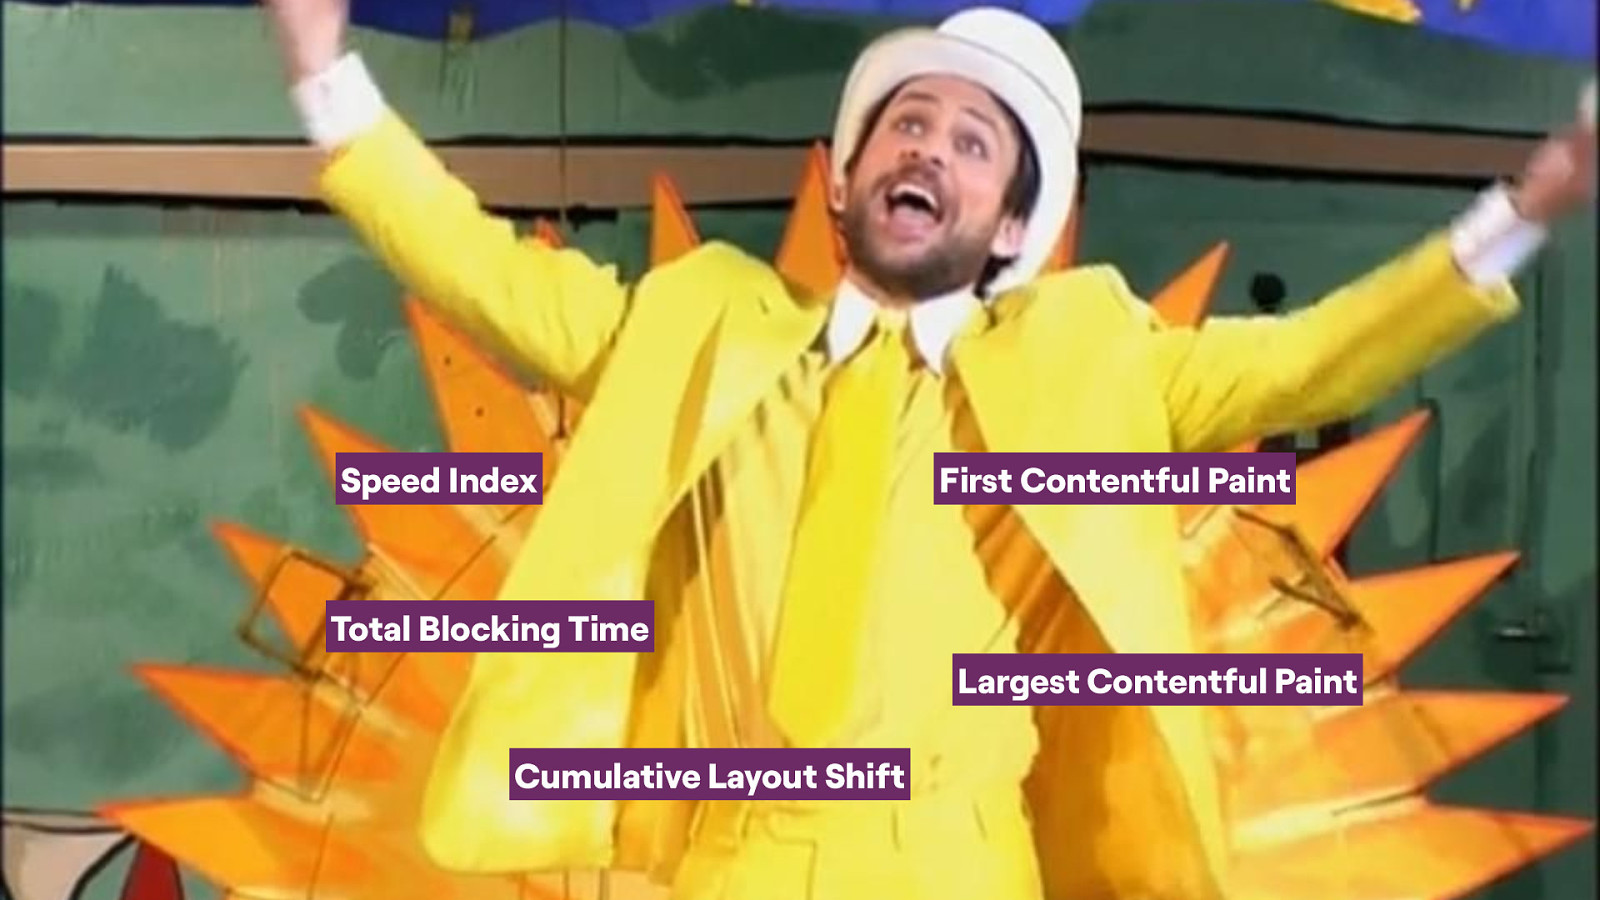
Speed Index First Contentful Paint Total Blocking Time Largest Contentful Paint Cumulative Layout Shift
How do I implement performance metrics?
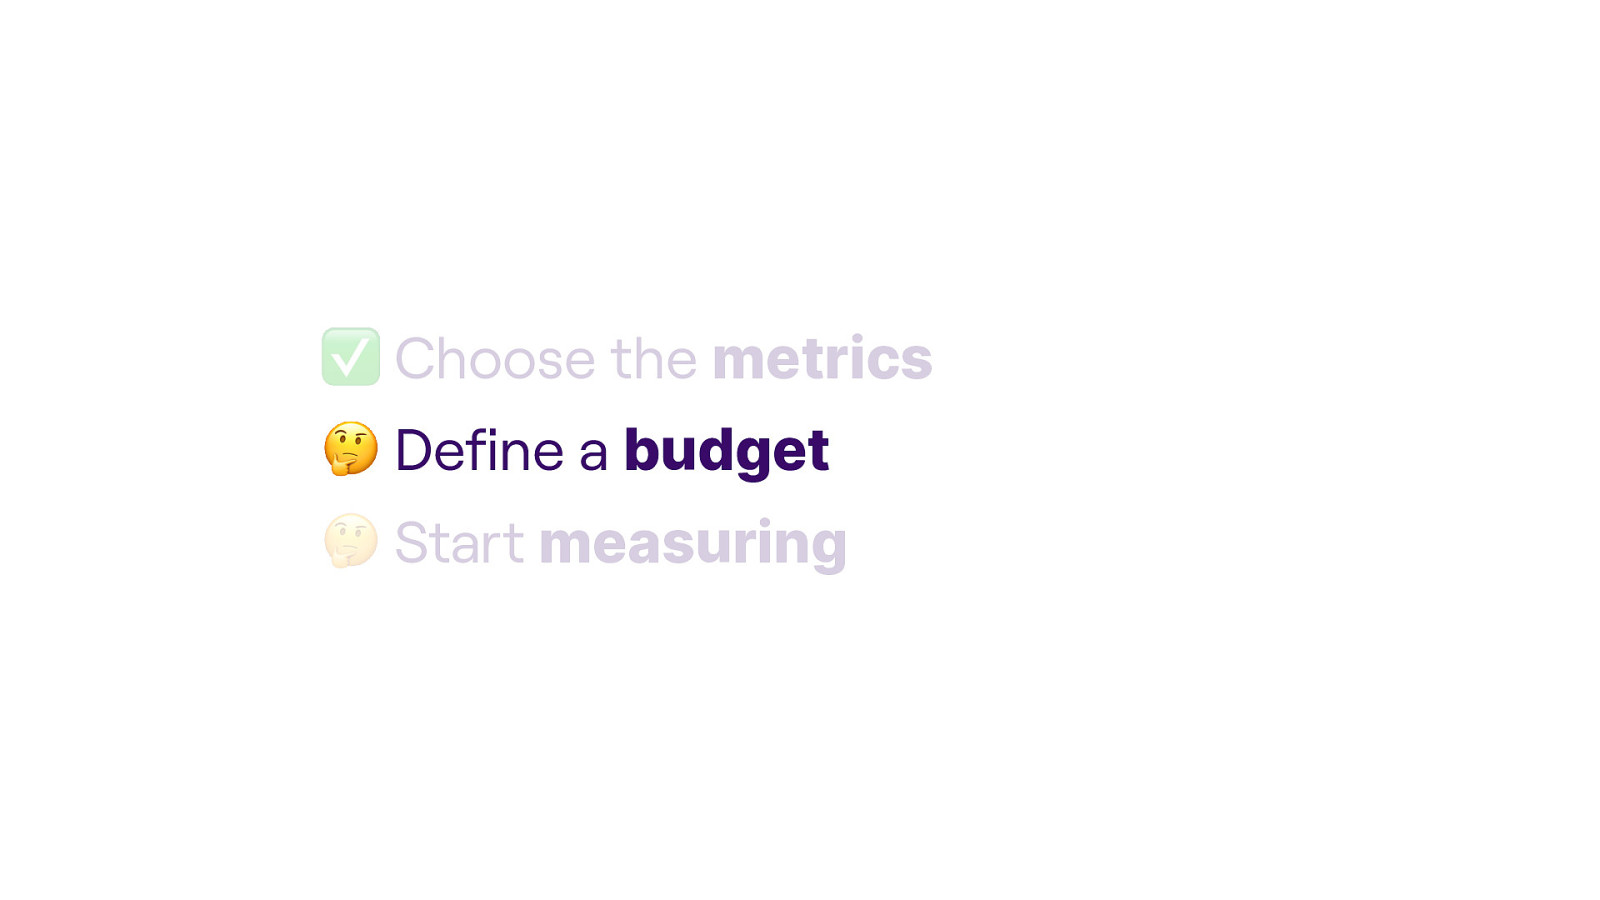
✅ Choose the met ics 🤔 Define a budget r r 🤔 Start measu ing
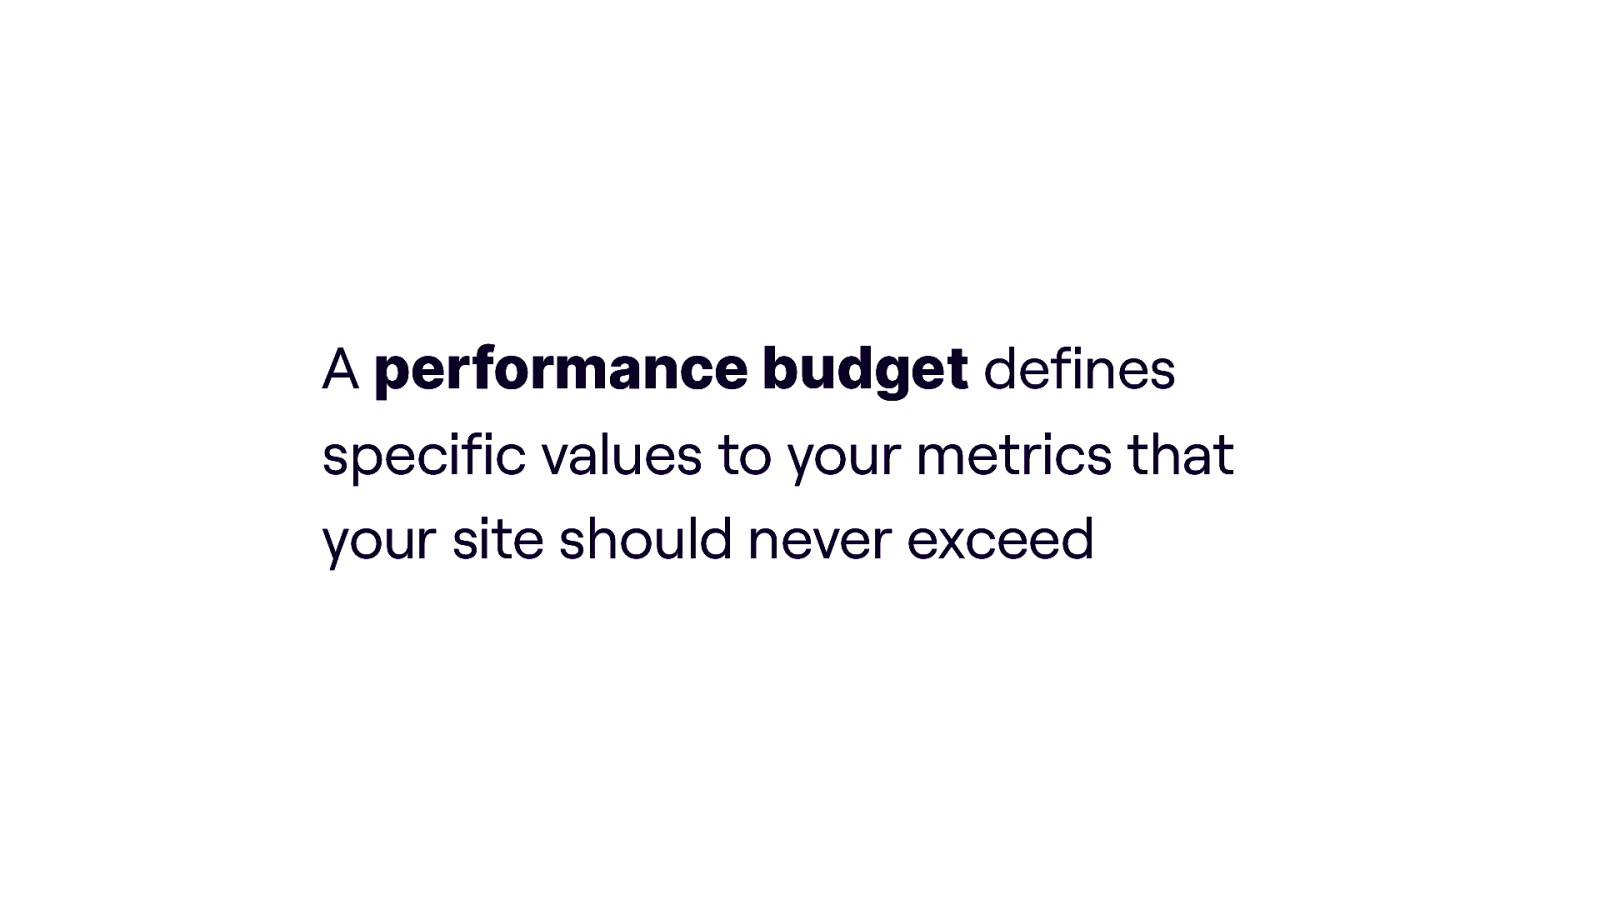
r r A pe fo mance budget defines specific values to your metrics that your site should never exceed
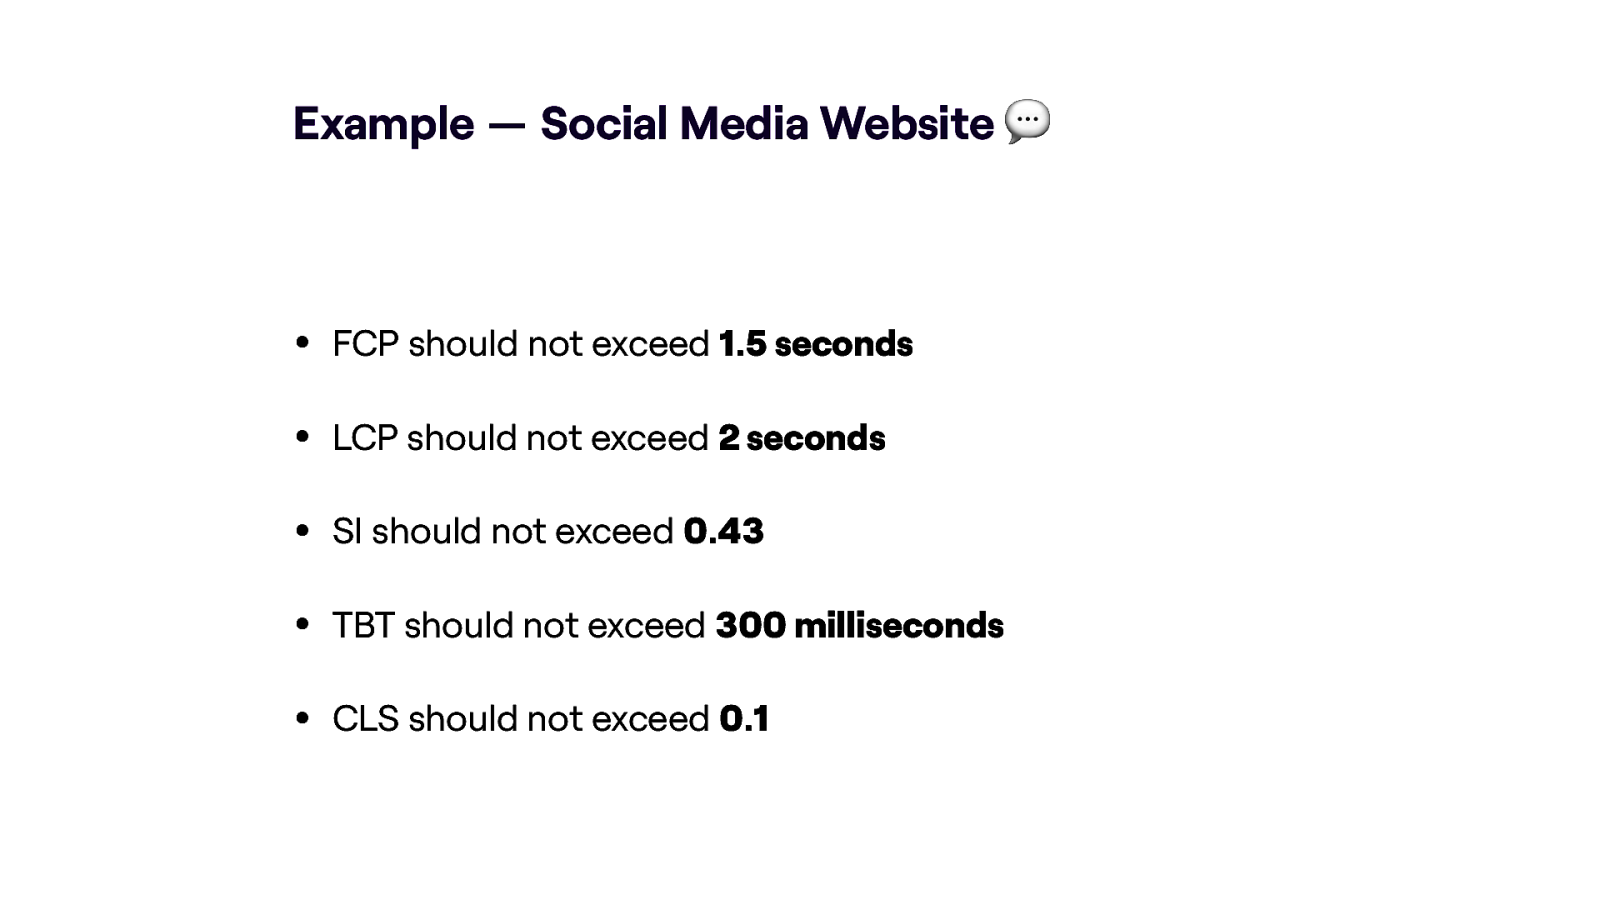
Example — Social Media Website 💬 • FCP should not exceed 1.5 seconds • LCP should not exceed 2 seconds • SI should not exceed 0.43 • TBT should not exceed 300 milliseconds • CLS should not exceed 0.1

[{ “path”: ” “, “timings”: [ { “metric”: “first-contentful-paint”, “budget”: 1500 }, { “metric”: “largest-contentful-paint”, “budget”: 2000 }, { “metric”: “speed-index”, “budget”: 0.43 }, { “metric”: “total-block-time”, “budget”: 300 }, { “metric”: “cumulative-layout-shift”, “budget”: 0.1 } ], * / }]

How do I define a budget?
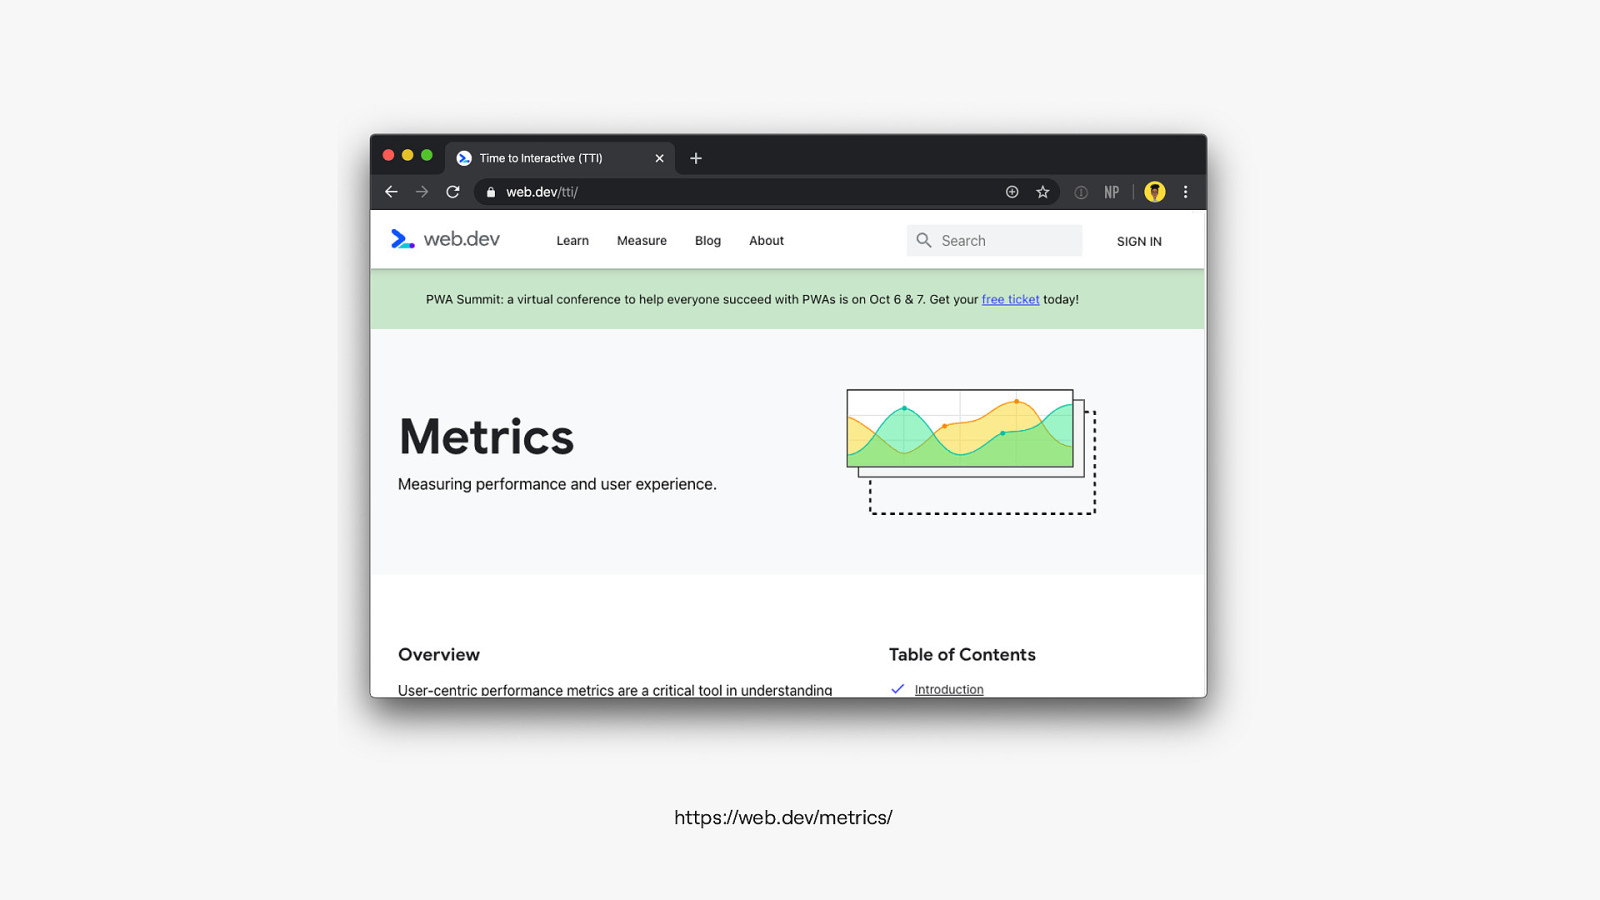
https://web.dev/metrics/
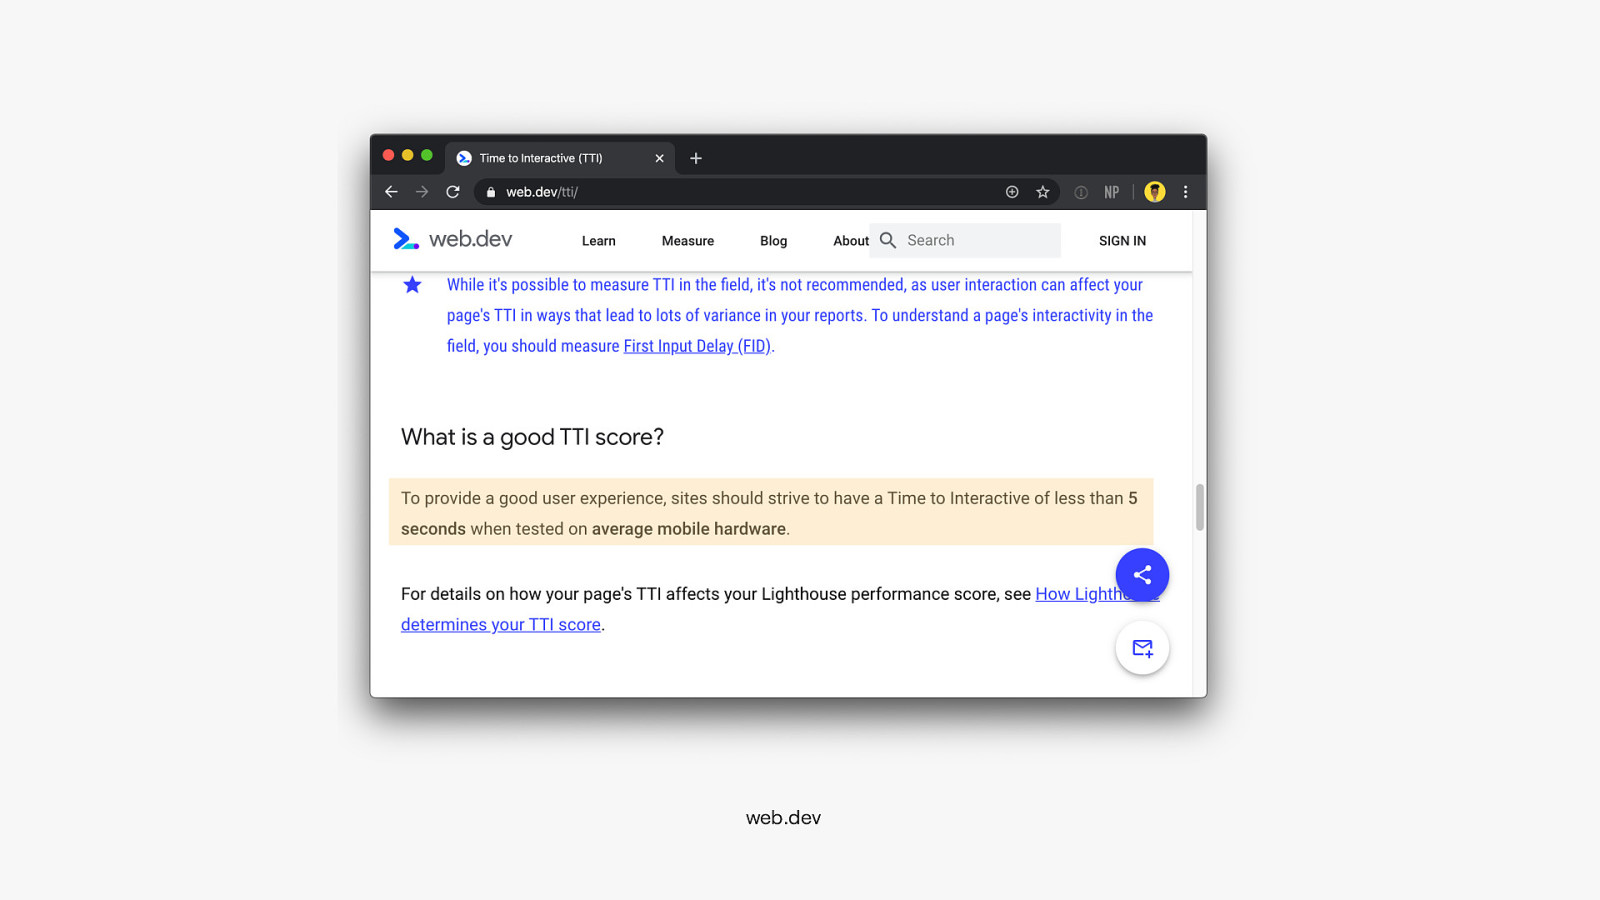
web.dev

Use your competitors as a baseline/guide

✅ Choose the met ics ✅ Define a budget r r 🤔 Start measu ing
✅ Choose the met ics ✅ Define a budget r r 🤔 Start measu ing

Lab Measuring vs Field Measuring
Measuring in the lab Using tools to simulate a page load in a consistent and controlled environment

Measuring in the field Getting information from when real users engage with the page
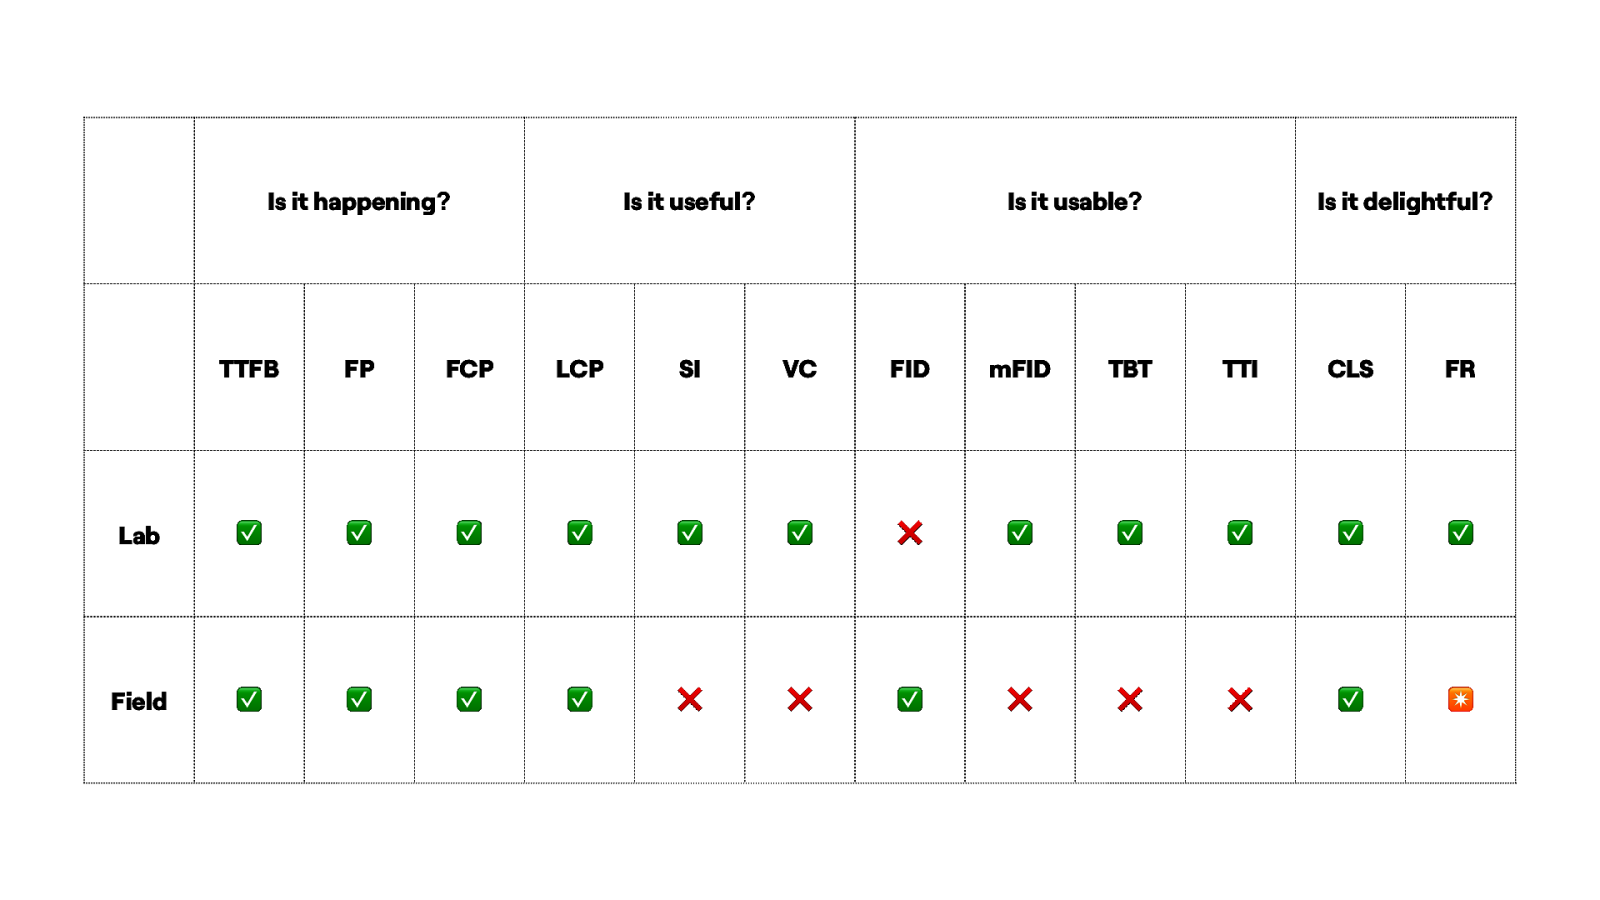
Is it happening? Is it useful? Is it usable? Is it delightful? TTFB FP FCP LCP SI VC FID mFID TBT TTI CLS FR Lab ✅ ✅ ✅ ✅ ✅ ✅ ❌ ✅ ✅ ✅ ✅ ✅ Field ✅ ✅ ✅ ✅ ❌ ❌ ✅ ❌ ❌ ❌ ✅ ✴
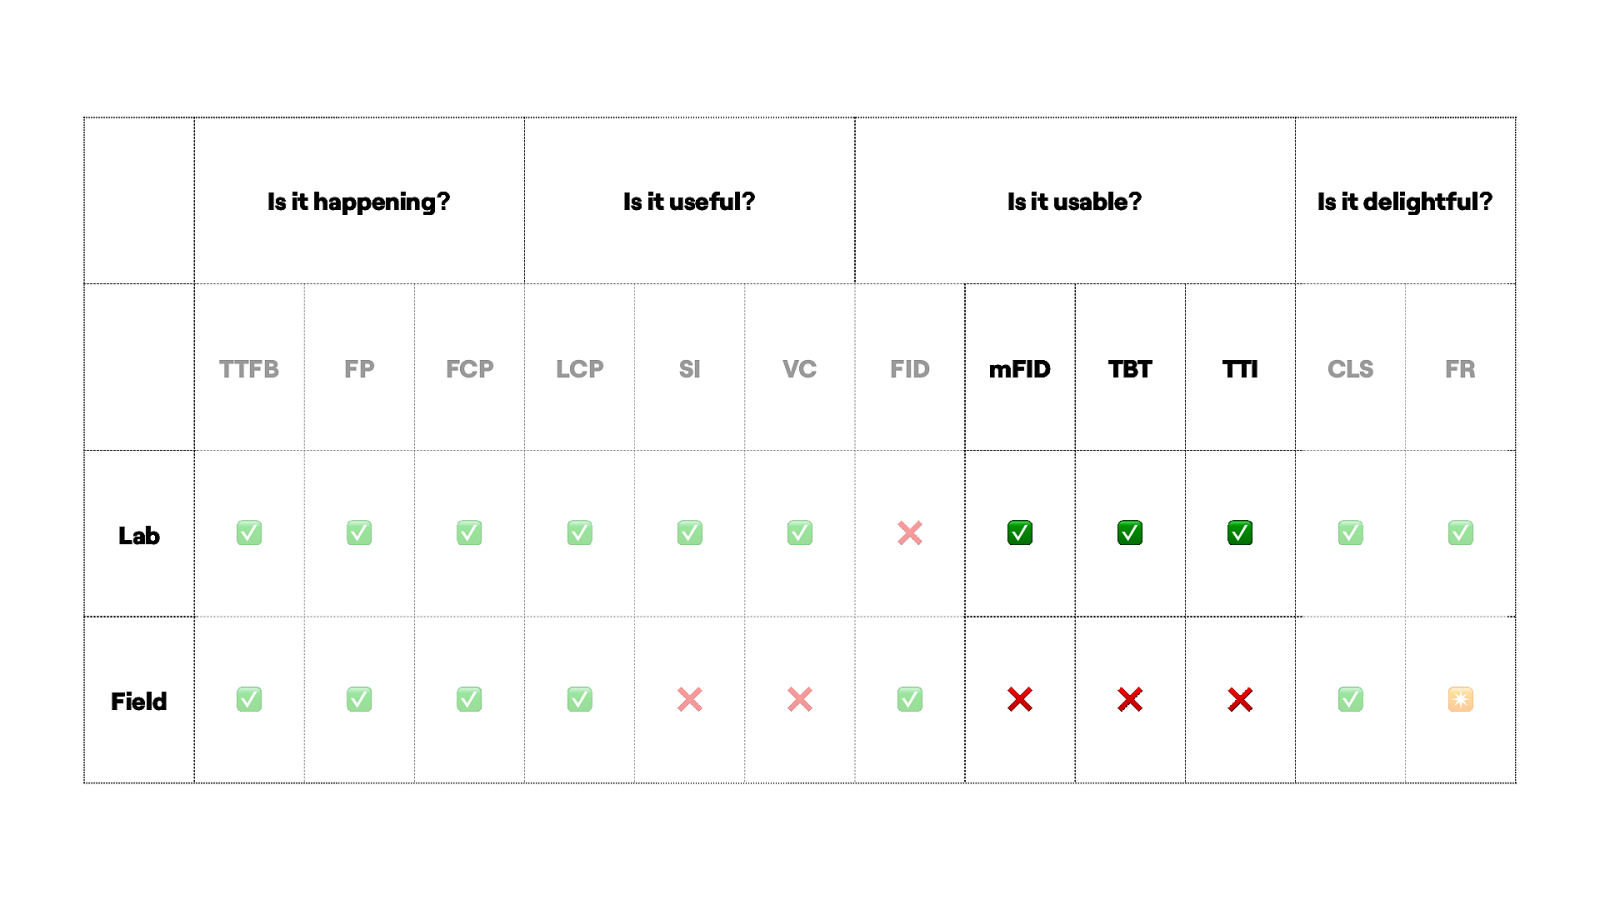
Is it happening? Is it useful? Is it usable? Is it delightful? TTFB FP FCP LCP SI VC FID mFID TBT TTI CLS FR Lab ✅ ✅ ✅ ✅ ✅ ✅ ❌ ✅ ✅ ✅ ✅ ✅ Field ✅ ✅ ✅ ✅ ❌ ❌ ✅ ❌ ❌ ❌ ✅ ✴
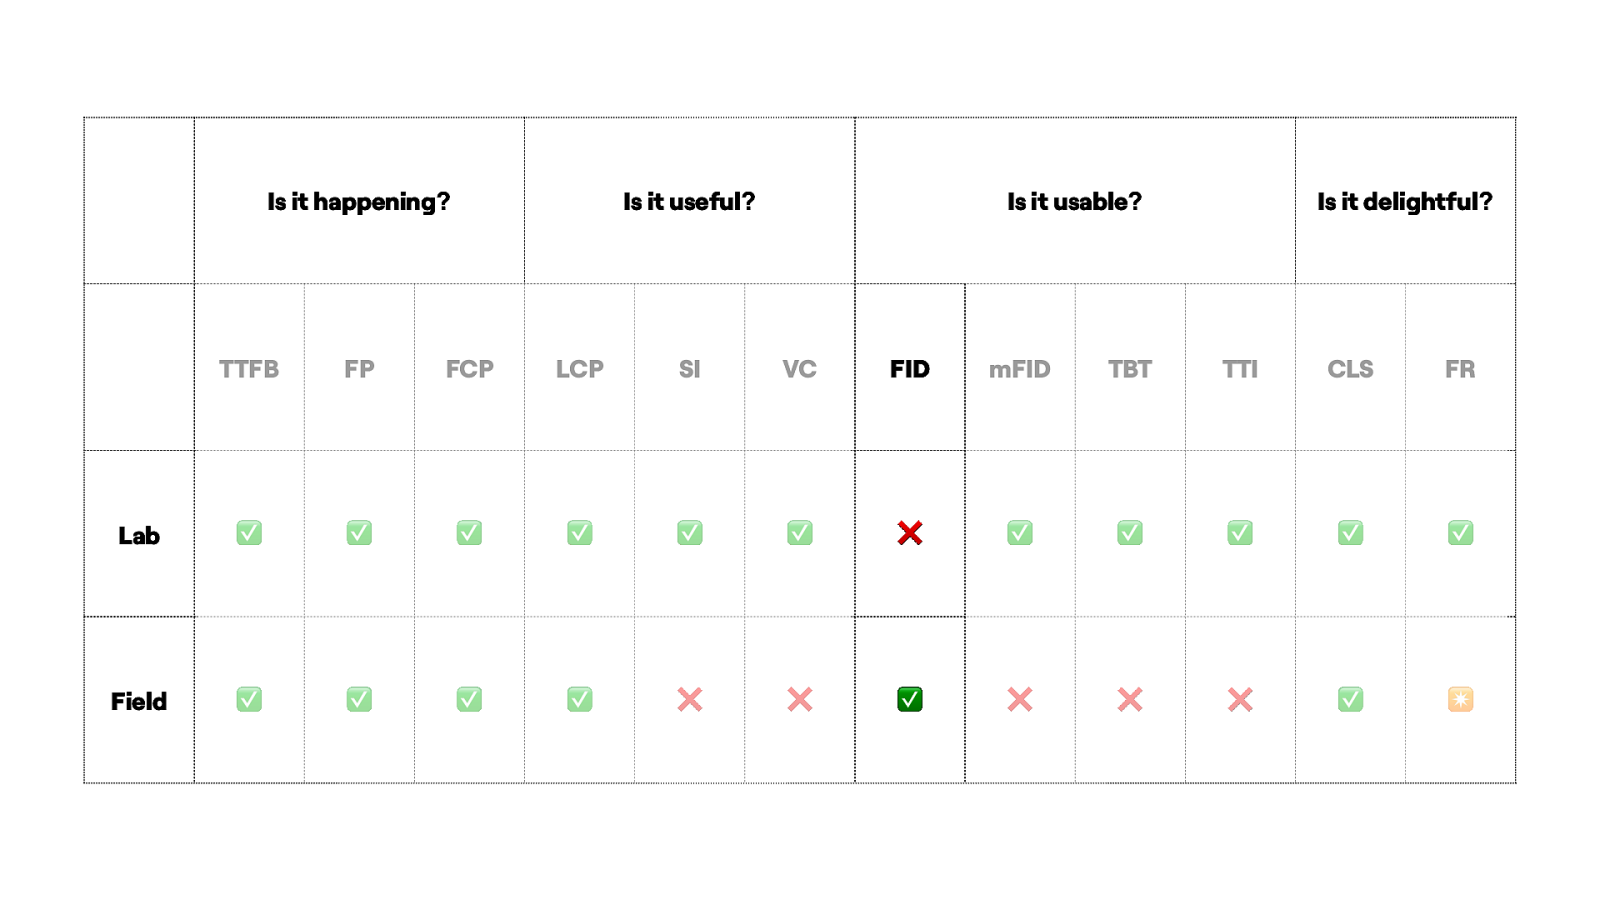
Is it happening? Is it useful? Is it usable? Is it delightful? TTFB FP FCP LCP SI VC FID mFID TBT TTI CLS FR Lab ✅ ✅ ✅ ✅ ✅ ✅ ❌ ✅ ✅ ✅ ✅ ✅ Field ✅ ✅ ✅ ✅ ❌ ❌ ✅ ❌ ❌ ❌ ✅ ✴
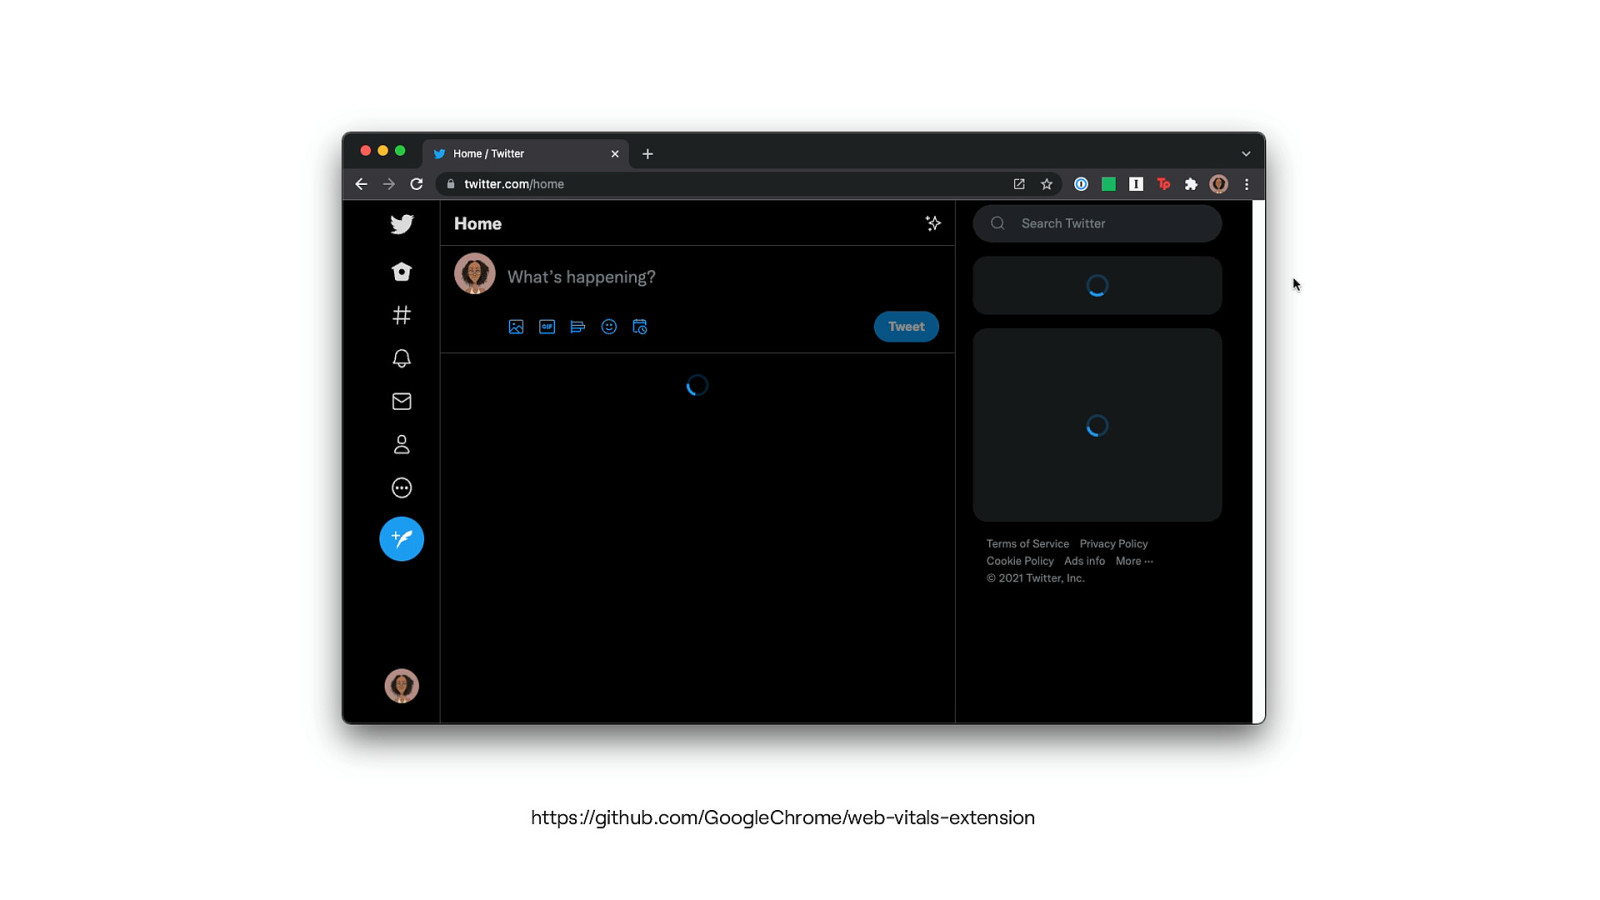
https://github.com/GoogleChrome/web-vitals-extension
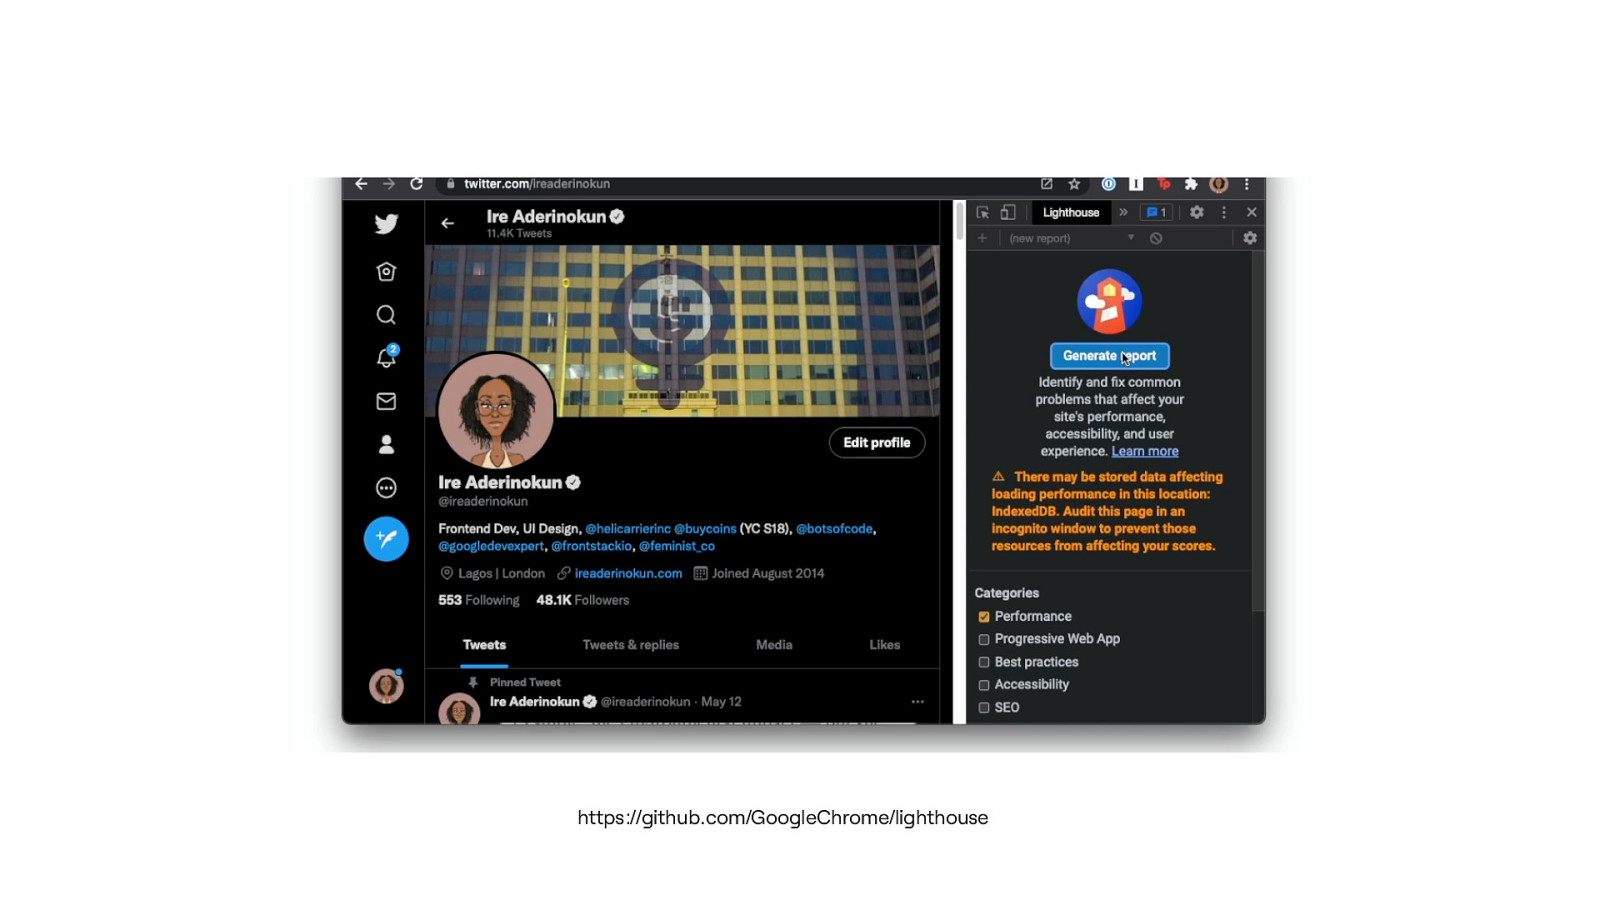
https://github.com/GoogleChrome/lighthouse
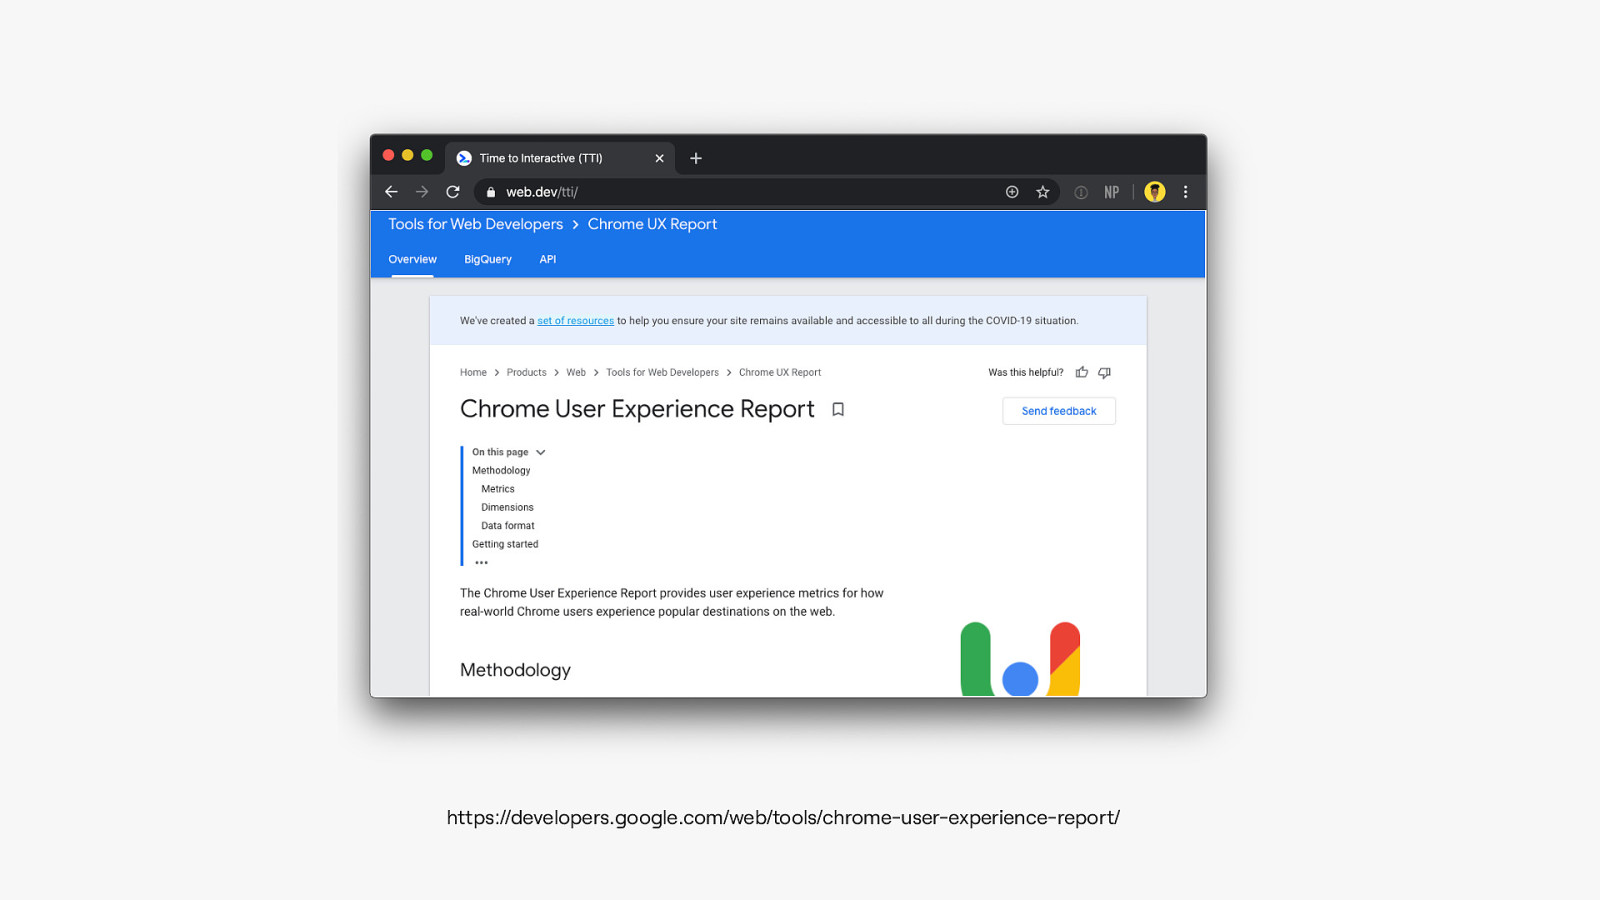
https://developers.google.com/web/tools/chrome-user-experience-report/
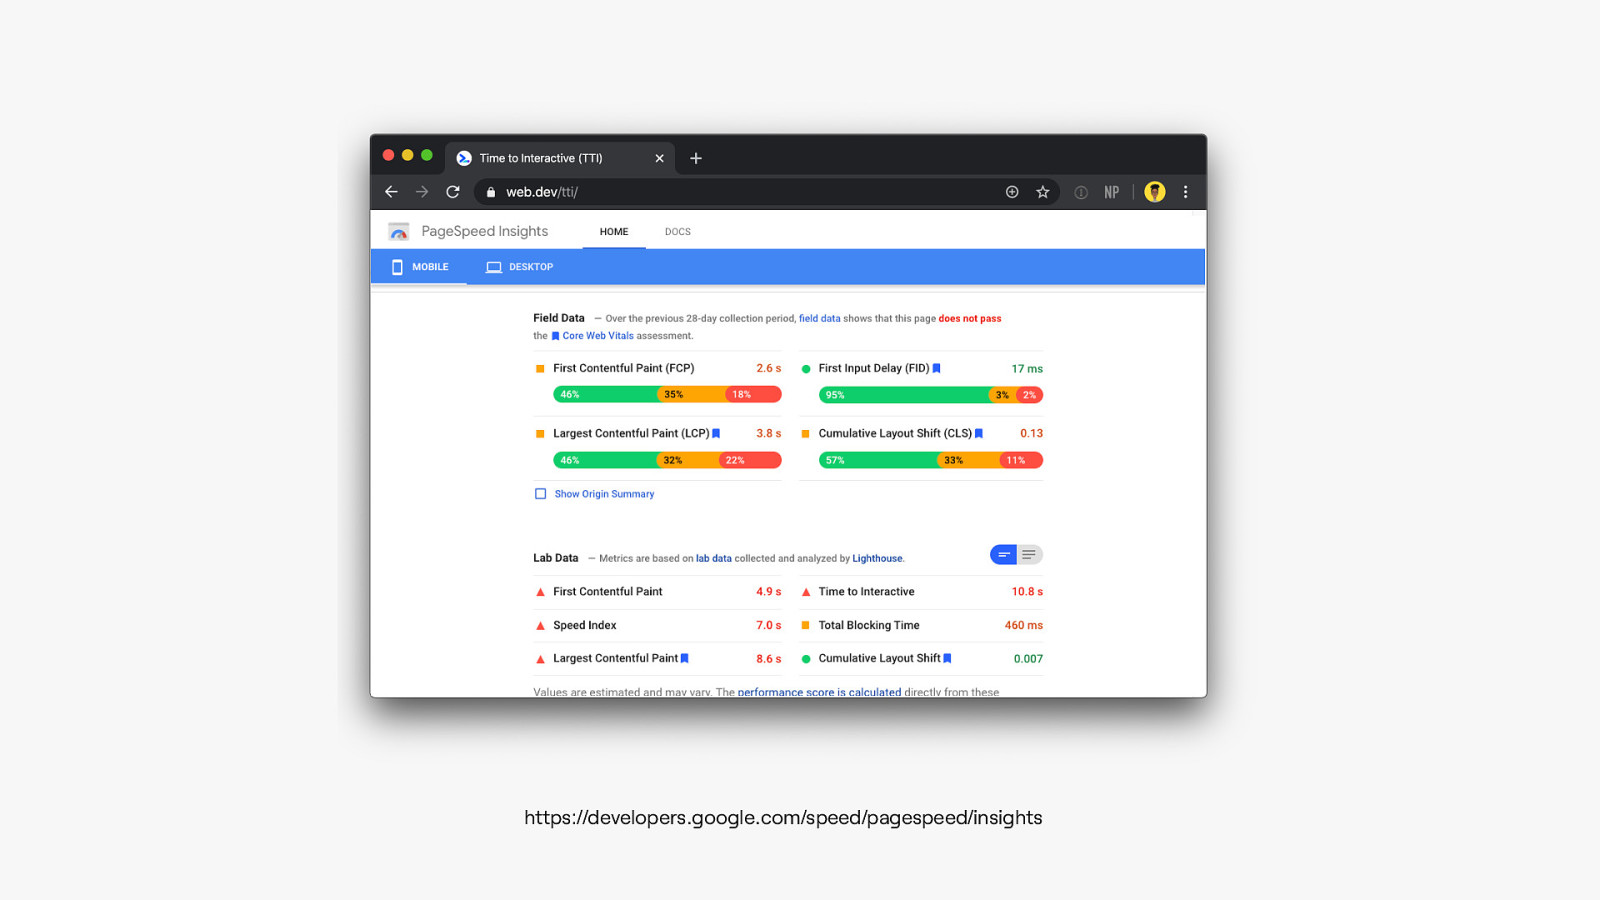
https://developers.google.com/speed/pagespeed/insights
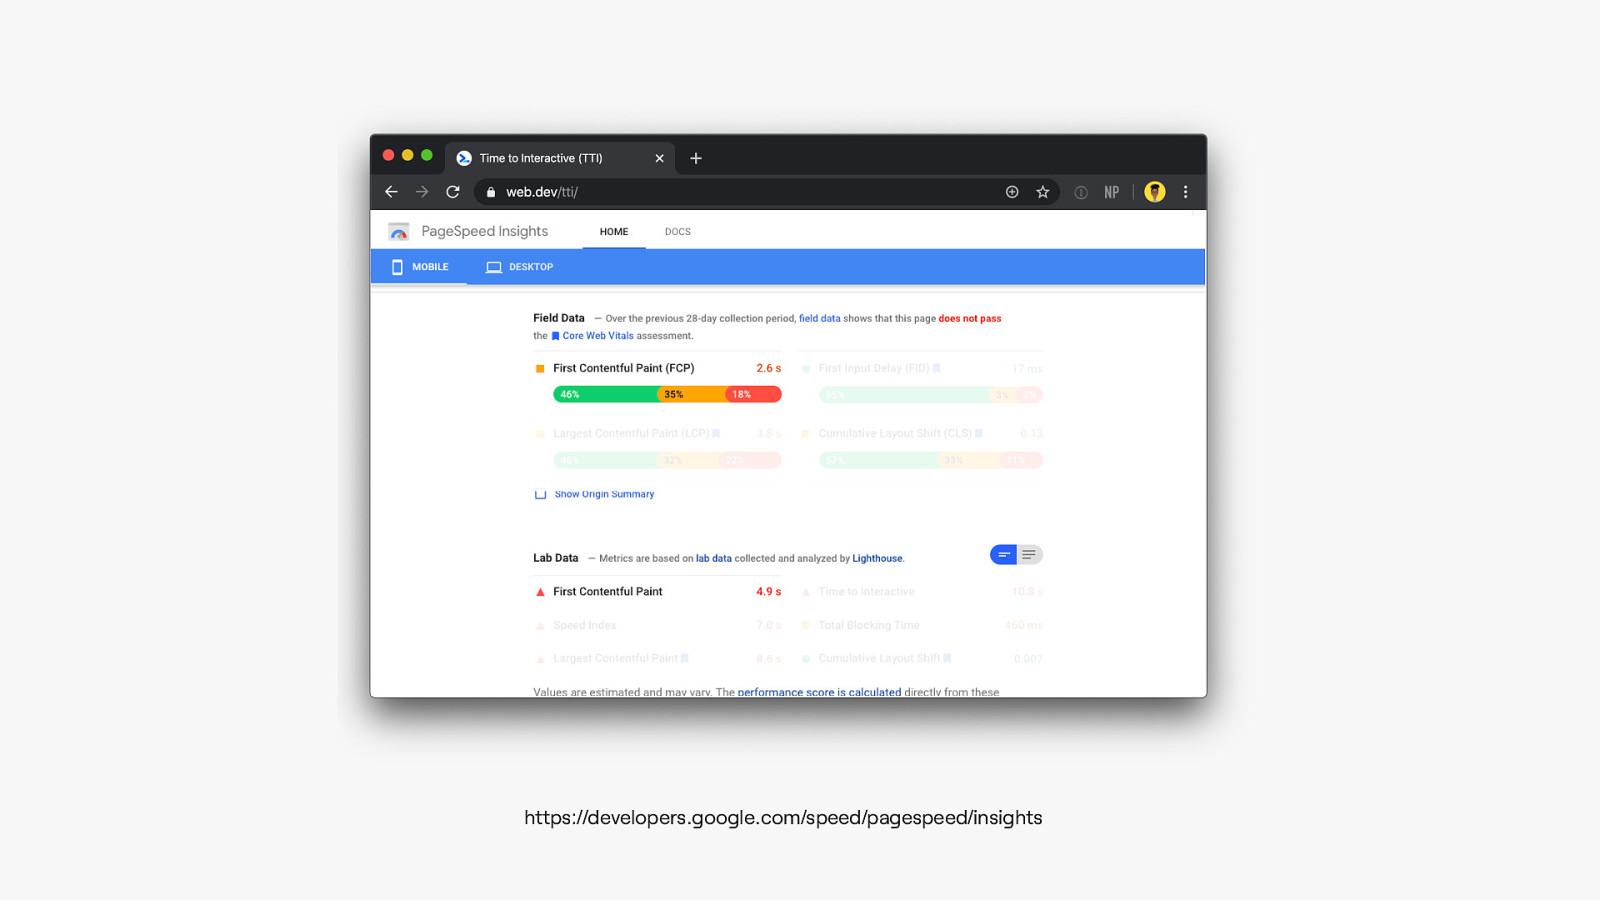
https://developers.google.com/speed/pagespeed/insights
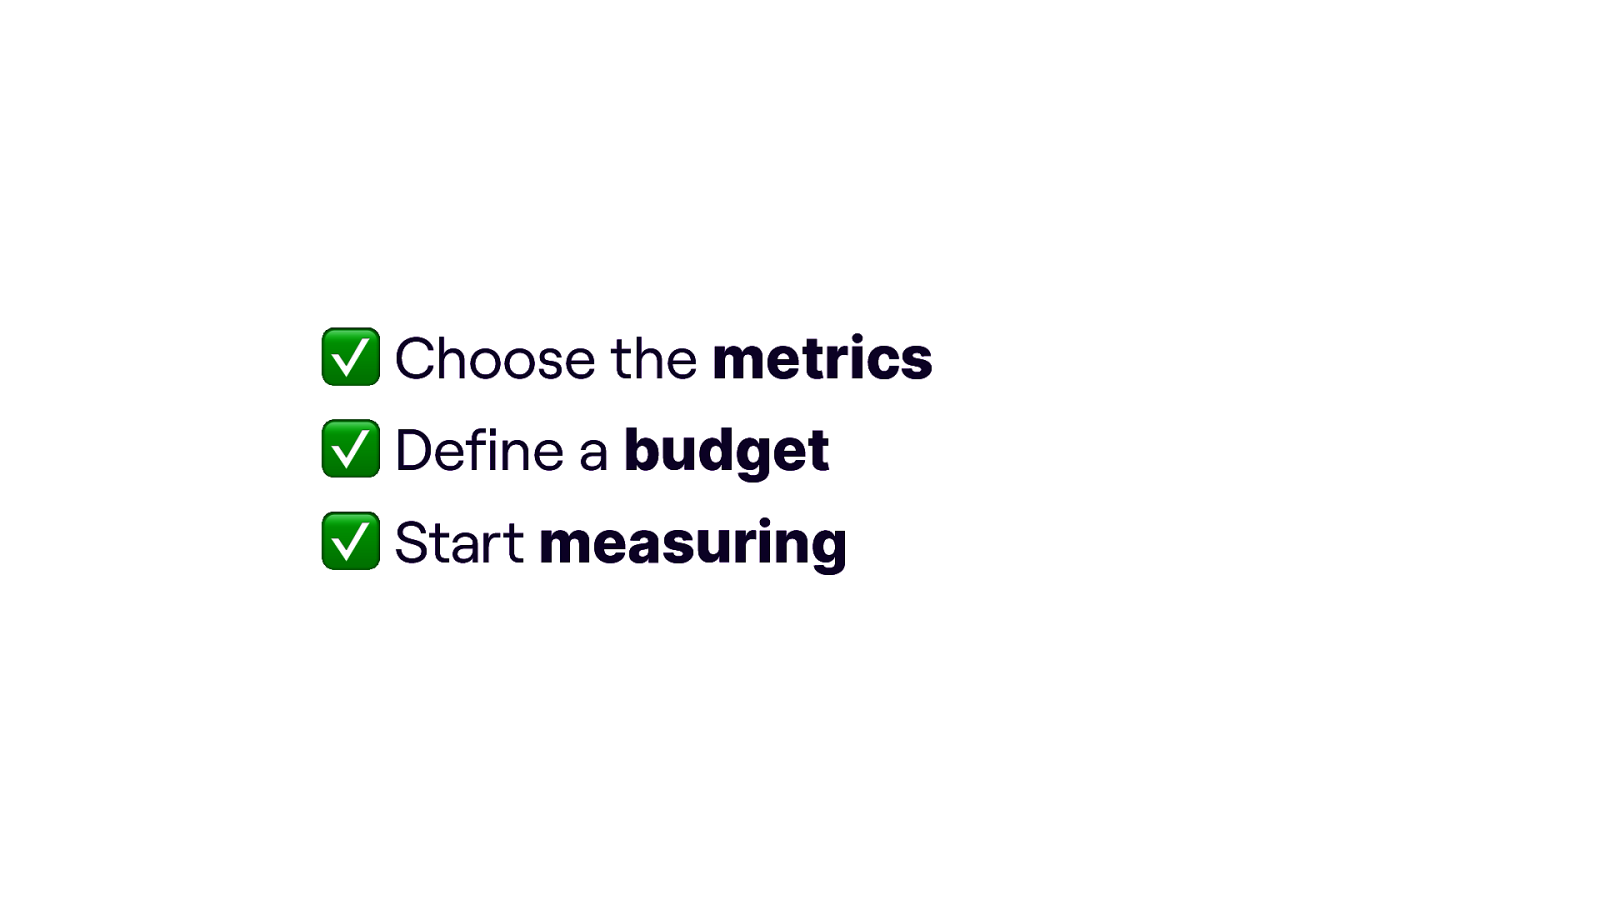
✅ Choose the met ics ✅ Define a budget r r ✅ Start measu ing


Thank you! ireaderinokun.com bitsofco.de @ireaderinokun
We all know that web performance is important; faster websites are beneficial for all users, no matter the country or the internet speed. But making websites more performant can be a daunting task. With a plethora of acronyms, it can be difficult to know where to start. This talk will cover how to make sense of the confusing world of web performance metrics, how to choose the right ones for your site, and how to implement them.
